Why Oil Prices Have Been Relatively Flat
On January 18, 2018, US crude oil (USO) (USL) March 2018 futures were almost unchanged at $63.89 per barrel.
Nov. 20 2020, Updated 1:39 p.m. ET

US crude oil
On January 18, 2018, US crude oil’s (USO) (USL) March 2018 futures were almost unchanged at $63.89 per barrel, ~0.6% below US crude oil active futures’ three-year high on January 12, 2018.
On the same day, the EIA (US Energy Information Administration) reported a decline in oil inventories. US crude oil inventories for the week ended January 12, 2018, declined by 6.9 MMbbls (million barrels) to 412.7 MMbbls. The decline was sufficient to reduce the gap between US crude oil inventories and their five-year average.
However, US crude oil production for the same week rose by 258 thousand barrels per day to 9.8 MMbpd (million barrels per day), just 0.4% below its record high based on the weekly data.
The OPEC monthly oil market report released on January 18, 2018, indicated a rise of 42.4 thousand barrels per day in its oil production in December 2017 on a month-over-month basis, according to secondary source data. However, the group’s oil production was below the agreed ceiling at the 32.5 million barrel per day mark.
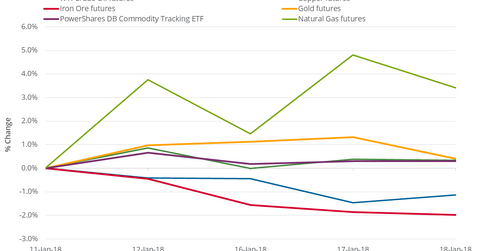
Between January 11 and January 18, 2018, US crude oil futures rose just 0.3%. In this period, the S&P 500 Index (SPY) (SPX-INDEX) and the Dow Jones Industrial Average Index (DIA-INDEX) rose 1.1% and 1.7%, respectively. In the next part of this series, we’ll focus on oil’s role in the performance of these equity indexes.
Natural gas
On January 18, 2018, natural gas (UNG) (BOIL) February 2018 futures declined 1.3% and closed at $3.19 per MMBtu (million British thermal units). For the week ended January 12, 2018, EIA (U.S. Energy Information Administration) data showed a fall of 183 Bcf (billion cubic feet) in natural gas inventories, a smaller drop compared to the market expectations of a fall of 201 Bcf.
Natural gas inventories were 12.3% below their five-year average. The gap widened by only 20 basis points into negative territory on a weekly basis. If natural gas inventories had fallen by 201 Bcf, this gap would have widened in the negative territory by 80 basis points. In the trailing week, natural gas futures rose 3.4%.
