What’s Driving PNC Financial Services?
The PNC Financial Services Group’s (PNC) revenue net of interest expense remained flat in 2016 and grew 8% in 2017.
Jan. 26 2018, Updated 12:40 p.m. ET

What drove the revenue?
PNC Financial Services Group’s (PNC) revenue net of interest expense remained flat in 2016 and grew 8% in 2017. Net interest income grew 1% and 9% in 2016 and 2017, respectively. Noninterest income dropped 3% in 2016 before gaining 7% in 2017.
What drove the diluted EPS?
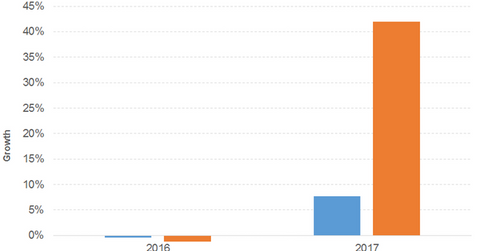
Noninterest expense remained flat in 2016 before rising 10% in 2017. As a result, income before income taxes fell 1% in 2016 before gaining 4% in 2017. Diluted EPS dropped 1% in 2016 before gaining 42% in 2017. Share buybacks have further enhanced the EPS numbers. The 2017 EPS number has further benefitted from the tax legislation in 4Q17.
A look at cash flows and dividend yield
The company has an impressive free cash flow position. Dividend yield remained uniform in 2016 and 2017 after a drop from 2015 due to higher dividend growth and uniform price gains in 2016 and 2017.
The PNC Financial Services Group’s dividend yield of 2% and PE of 14.9x compares to a sector average dividend yield of 2% and a PE of 20.7x. Prices rose 23%, 23%, and 8% in 2016, 2017, and on a YTD basis, respectively.
Company versus the broad market indexes
The S&P 500 (SPX-INDEX) (SPY) offers a dividend yield of 2.2% and a PE ratio of 24.6x. Prices rose 10%, 19%, and 5% in 2016, 2017, and on a YTD basis, respectively.
The Dow Jones Industrial Average (DJIA-INDEX) (DIA) has a dividend yield of 2.1% and a PE ratio of 24.9x. It rose 13%, 25%, and 5% in 2016, 2017, and on a YTD basis, respectively.
The NASDAQ Composite (COMP-INDEX) (ONEQ) has a PE ratio of 25.4x. Prices gained 8%, 28%, and 6% in 2016, 2017, and on a YTD basis, respectively.
Going forward
2017 saw three increases in prime lending rates and an agreement to acquire ECN Capital’s US Commercial Vendor Finance Business. The company is looking forward to the potential deregulation of Dodd-Frank and Fed rate hikes in 2018.
ETFs
The iShares U.S. Regional Banks ETF (IAT) has a PE of 18.4x and a dividend yield of 1.5%. The First Trust Nasdaq Bank ETF (FTXO) has a PE of 16.1x and dividend yield of 1%.
