Are US Crude Oil Rigs Indicating a Slowdown in Oil Production?
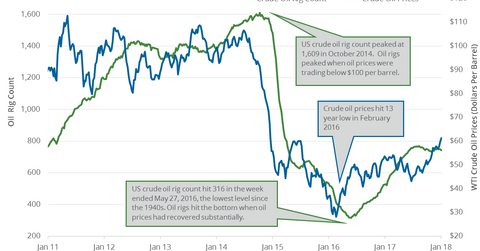
On January 19, 2018, Baker Hughes released its weekly US crude oil rigs report. US crude oil rigs decreased by five to 747 on January 12–19, 2018.
Jan. 23 2018, Published 8:26 a.m. ET

US crude oil rigs
On January 19, 2018, Baker Hughes, a GE company, released its weekly US crude oil rigs report. US crude oil rigs decreased by five to 747 on January 12–19, 2018. However, rigs increased by 196 or 36% from a year ago.
US crude oil prices are near a three-year high. Higher oil (SCO) (USL) prices favor funds like the VanEck Vectors Oil Services ETF (OIH). Higher prices also favor drillers like Halliburton (HAL) and Transocean (RIG).
Peaks and lows
US crude oil rigs tested 1,609 in October 2014—the highest level ever. On the other hand, US crude oil rigs tested 316 in May 2016—the lowest level since the 1940s. Rigs have increased by 431 or 137% since the lows in May 2016 due to higher oil prices.
Monthly drilling report
US shale oil production in the seven shale regions could rise by 111,000 bpd (barrels per day) to 6,549,000 bpd in February 2018—compared to the previous month. It will be the 14th consecutive rise in US shale oil production. Any increase in US crude oil production is bearish for oil (UWT) (USO) prices.
Impact
US crude oil rig counts have averaged ~747 since September 2017. However, US crude oil (DBO) has risen ~50% since June 2017. Slowing rigs suggest that US crude oil production could slow down.
However, US production has risen 15.6% since July 2016. It’s expected to hit a new record in 2018, according to the EIA. Higher oil (SCO) prices could increase US oil rigs and production, which could pressure oil (DWT) prices in 2018.
Next, we’ll discuss the important drivers for crude oil prices.
