What Technical Indicators Say about Cliffs and Peers
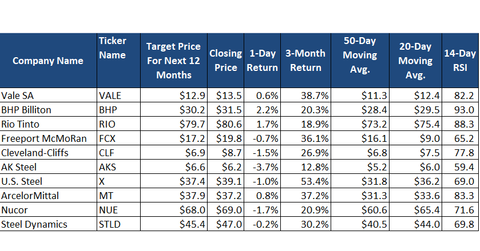
Based on its January 12, 2018, closing price, Cleveland-Cliffs is trading ~28% above its 50-day moving average and 15.4% above its 20-day moving average.
Jan. 19 2018, Updated 9:00 a.m. ET

Technical indicators
In this article, we’ll take a look at technical indicators such as moving averages and the relative strength index (or RSI). A significant up or down move of the company’s stock price over its moving averages may signify an overbought or oversold level. Similarly, an RSI score of 30 or less indicates an oversold situation, while an RSI above 70 is associated with overbought levels for assets under consideration.
Cleveland-Cliffs’ moving averages
Based on its January 12, 2018, closing price, Cleveland-Cliffs is trading ~28% above its 50-day moving average and 15.4% above its 20-day moving average. Among all its seaborne and US steel peers, CLF is trading at the highest premium to its moving averages. Its stock is very sensitive to changes in seaborne iron ore prices and US steel prices. The recent strength in iron ore prices is supporting iron ore miners like Cliffs.
Technicals of CLF’s peers
Cliffs is also trading with a 14-day RSI level of 77.8, which is already past the overbought level of 70. Its peers, especially the seaborne iron ore miners, are trading at even higher RSI levels. BHP (BHP) is trading at 93, while Rio Tinto (RIO) and Vale SA (VALE) have RSI scores of 88.3 and 82.2, respectively. The recent surge in the iron ore prices has been supporting higher stock prices for these miners.
US steel peers (SLX) ArcelorMittal (MT), Nucor (NUE), and Steel Dynamics (STLD) are trading at high RSIs of 83.3, 71.6, and 69.8, respectively.
The overbought situation usually means that a pullback in the prices is likely. However, it isn’t always a given that the prices will go lower. Stocks can remain oversold or overbought for long periods.
