Reading the Technicals and Price Movements of Mining Stocks
In this article, we’ll do a technical analysis of a few select mining stocks. When investing in mining stocks, it’s crucial to read their indicators.
Jan. 26 2018, Updated 12:50 p.m. ET

Mining stock analysis
In this article, we’ll do a technical analysis of a few select mining stocks. When investing in mining stocks, it’s crucial to read their indicators, which include metrics such as volatility.
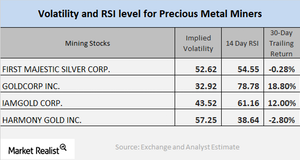
In this case, we’ll be analyzing implied volatility, which is a measurement of the price changes in a stock given the fluctuations in its call option price. We’ll also examine the RSI (relative strength index), which measures the overbought or underbought status of an asset.
For our analysis, we’ve selected Royal Gold (RGLD), Newmont Mining (NEM), Sibanye Gold (SBGL), and Buenaventura (BVN). All four of these miners have seen positive returns over the past month as the price of precious metals has scaled upward. RGLD, NEM, SBGL, and BVN have risen 2.2%, 9.2%, 7.6%, and 10.8%, respectively, on a trailing-30-day basis.
Volatility and RSI reading
The implied volatilities of RGLD, NEM, SBGL, and BVN are 24.8%, 24.6%, 47.9%, and 32%, respectively. The RSI levels of RGLD, NEM, SBGL, and BVN are 76.7, 72, 50, and 62.5, respectively. Don’t forget that when a stock’s RSI level is above 70, it indicates that it could be in overbought territory, and its price could fall. Similarly, when a stock’s RSI level is below 30, it indicates that the stock could be oversold and that its price could rise.
Like mining stocks, other funds also take much of their price movements from precious metals. Funds such as the Alps Sprott Gold Miners ETF (SGDM) and the iShares MSCI Global Gold Miners ETF (RING) have risen 5.2% and 5.1%, respectively, on a trailing-30-day basis due to the rise of gold and silver.
