Why Citigroup’s Outlook Seems Promising
Citigroup is projected to grow its revenue 2% and 4% in 2017 and 2018, respectively. The 2017 and 2018 diluted EPS are projected to grow 12% and 14%, respectively.
Jan. 10 2018, Updated 3:43 p.m. ET

How Citigroup managed to recover from a revenue fall
Citigroup’s revenue fell by 8% in 2016. The decline in 2016 was due to lower net interest and non-interest revenue. The Global Consumer Banking, Institutional Clients Group, Citi Holdings, and Corporate segments recorded declines. North America in the Global Consumer Banking segment recorded some growth, offset by Latin America and Asia. In the Institutional Clients Group segment, only Europe, the Middle East, and Africa (or EMEA) recorded some growth offset by North America and Latin America.
Revenue grew 3% in 9M17. Non-interest revenue drove growth, offset by net interest revenue. The Global Consumer Banking, Institutional Clients Group, and Corporate segments recorded growth in every geographic region. The corporate segment includes the Citi Holdings segment.
What drove the recovery in EPS?
Operating expenses fell 5% in 2016 and remained flat in 9M17. As a result, income from continuing operations fell 13% in 2016 before gaining 7% in 9M17. Adjusted income from continuing operations declined 12% in 2016 before gaining 9% in 9M17.
Adjusted net income fell 16% in 2016 before gaining 6% in 9M17. Adjusted diluted EPS fell 12% in 2016 before gaining 13% in 9M17. Share buybacks have enhanced EPS numbers.
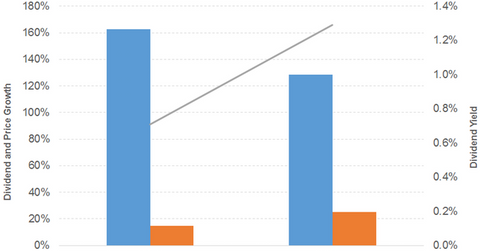
Dividend and price growth
Dividend per share grew 163% and 129% in 2016 and 2017, respectively. Prices rose 15% and 25% in 2016 and 2017, respectively. As a result, the dividend yield curve also started sloping upwards. A forward PE of 14.1x and a dividend yield of 1.7% compares to a sector average forward PE of 17.8x and a dividend yield of 2.1%.
How does it compare to the broad indexes?
The S&P 500 (SPX-INDEX)(SPY) offers a dividend yield of 2.2%, a PE ratio of 23.4x, and a YTD return of 19.6%. The Dow Jones Industrial Average (DJIA-INDEX)(DIA) has a dividend yield of 2.2%, a PE ratio of 22.3x, and a YTD return of 25.1%. The NASDAQ Composite (COMP-INDEX)(ONEQ) has a PE ratio of 28.2x and a YTD return of 24.8%.
Revenue and EPS outlook
Citigroup is projected to grow its revenue 2% and 4% in 2017 and 2018, respectively. The 2017 and 2018 diluted EPS are projected to grow 12% and 14%, respectively.
Dividend ETFs with exposure to Citigroup
The Fidelity Dividend ETF for Rising Rates (FDRR) has a PE of 17x and a dividend yield of 2.9%. The Fidelity Core Dividend ETF (FDVV) has a PE of 15.5x and a dividend yield of 2.6%.
