Building Permits Fall in November: Should We Worry?
Building permits and the economy The number of building permits issued each month is a constituent of the Conference Board LEI (Leading Economic Index). The construction and housing industry (PKB) is a major job provider in the economy, and changes in activity in the sector affect employment conditions and aggregate demand. A higher number of building permits is a leading […]
Jan. 5 2018, Updated 7:36 a.m. ET

Building permits and the economy
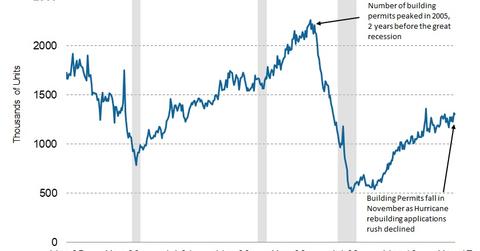
The number of building permits issued each month is a constituent of the Conference Board LEI (Leading Economic Index). The construction and housing industry (PKB) is a major job provider in the economy, and changes in activity in the sector affect employment conditions and aggregate demand. A higher number of building permits is a leading indicator of improved activity, as there is a time gap between the commencement of construction and building permit issuance. After the 2007–2008 housing (NAIL) market crash, building permits started rising in 2011 and have continued to do so.
Building permits fall in November
Whereas building permits fell from 1.31 million in October to 1.29 million permits in November, we should consider that October brought a surge in applications as homeowners rebuilt after the 2017 hurricane season. November saw the second-highest monthly count for building permits in 2017. Building permits, which have a 3.0% weight in the LEI, impacted it by 0.04 (or 4%) in November.
Market impact
In the United States, ETFs tracking housing markets appreciated considerably in 2017. The iShares US Home Construction ETF (ITB) and the SPDR S&P Homebuilders ETF (XHB), two major funds invested in the sector, outperformed the overall index in 2017. Changes to interest rate deductions for homes over $750,000 are not likely to have major effects, as the bulk of homes bought are below this threshold. In the next part of this series, we’ll analyze how the stock market (SPY) has affected the LEI.
