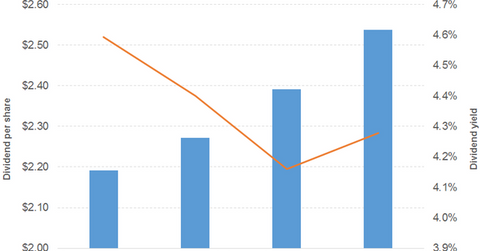
How Realty Income’s Dividend Yield Looks
Revenue and earnings Realty Income (O), a retail REIT engaged in US real estate investment, recorded 8% revenue growth in 2016, compared with 10% growth in 2015. The growth was driven by rentals and tenant reimbursements. Its operating costs and other expenses (including interest expenses) rose 6% in 2016 and 8% in 2015. Its gains on asset […]
Sept. 18 2017, Published 11:16 a.m. ET

Revenue and earnings
Realty Income (O), a retail REIT engaged in US real estate investment, recorded 8% revenue growth in 2016, compared with 10% growth in 2015. The growth was driven by rentals and tenant reimbursements.
Its operating costs and other expenses (including interest expenses) rose 6% in 2016 and 8% in 2015. Its gains on asset dispositions have fallen over the years, and its EPS (earnings per share) rose 4% in 2016 and 5% in 2015. The company has generated positive FFO (funds from operations) since 2014, in addition to recording growth.
Revenue and EPS in 1H17
Realty Income’s revenue grew 11% in 1H17, driven by rental and tenant reimbursements. Its operating costs and other expenses rose 10%, and it saw a higher gain on the sale of assets. In 1H17, its EPS grew 8%, and its FFO grew 12%.
Dividend
Whereas company’s dividend payout rose between 2015 and 2016, it fell between 1H16 and 1H17.
Stock price
Realty Income stock has beaten the VanEck Vectors Retail ETF (RTH) and the iShares US Financials ETF (IYF) most of the time over the last three years.
The WisdomTree International SmallCap Dividend ETF (DLS) offers a dividend yield of 2.7%, at a PE (price-to-earnings) ratio of 15x. It has major exposure to the Asia-Pacific region and Europe. It has a 20%, 13%, 7%, and 7% exposure to the consumer cyclical, financial, consumer non-cyclical, and real estate spaces, respectively. The WisdomTree Japan SmallCap Dividend ETF (DFJ) has a dividend yield of 1.7%, at a PE ratio of 14.9x. It has a 22%, 11%, 7%, and 3% exposure to the consumer cyclical, financial, consumer non-cyclical, and real estate spaces, respectively.
