Analyzing the Miners’ Crucial Indicators in September
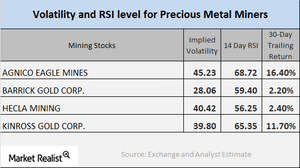
On September 11, 2017, Agnico-Eagle, Barrick Gold, Hecla Mining, and Kinross had volatilities of 45.2%, 28.1%, 40.4%, and 39.8%, respectively.
Sept. 13 2017, Updated 7:41 a.m. ET

Readings of the mining shares
The changes in precious metals are often closely tracked by mining shares. When investors intend to enter mining shares, they need to analyze several key technical indicators.
We’ll look at two important technical indicators—volatility and RSI levels for miners Agnico Eagle (AEM), Barrick Gold (ABX), Hecla Mining (HL), and Kinross Gold (KGC).
Implied volatility
The call-implied volatility measures variations in the price of an asset when it comes to changes in the price of its call option.
On September 11, 2017, Agnico-Eagle Mines, Barrick Gold, Hecla Mining, and Kinross Gold had volatilities of 45.2%, 28.1%, 40.4%, and 39.8%, respectively. The volatility of the mining stocks is usually greater than the volatilities of precious metals.
RSI indicator
RSI (relative strength index) indicates whether a share has been overbought or oversold. If a stock’s RSI is greater than 70, it may be overbought and its price may fall. If a stock’s RSI is lower than 30, it could be oversold and could move upward.
The RSI levels for the miners mentioned above have recently witnessed revivals. Agnico-Eagle Mines, Barrick Gold, Hecla Mining, and Kinross Gold have RSI levels of 68.7, 59.4, 56.3, and 65.4, respectively.
Among the mining funds, the iShares MSCI Global Gold ETF (RING) and the Sprott Gold Miners ETF (SGDM) are also impacted by changes in precious metal prices. These two funds lost 3% and 3.1%, respectively, on September 11, 2017.
