What’s the Forecast for Shell Stock for the Next 7 Days?
Implied volatility in Royal Dutch Shell (RDS.A) has fallen 4.9% since July 3, 2017, to the current level of 12.8%.
Dec. 4 2020, Updated 10:53 a.m. ET

What is implied volatility?
Before we look at implied volatility, let’s quickly take a look at volatility. Volatility calculates stock return changes in a particular period. If calculated based on historical stock prices, it’s called historical volatility.
We can also predict the future volatility of a security using an option pricing model, which is called implied volatility. High implied volatility would suggest that the stock price could move sharply and thus provide higher positive or negative returns. Conversely, with low implied volatility, lower positive or negative returns can be expected for a given period.
Implied volatility in Shell and peers
Implied volatility in Royal Dutch Shell (RDS.A) has fallen 4.9% since July 3, 2017, to the current level of 12.8%. During the same period, Shell stock rose 4.7%.
Similarly, implied volatility in Chevron (CVX) has fallen 2.0% over July 3 to 14.4%. Also, implied volatility in ExxonMobil (XOM) and BP (BP) have dropped 1.9% and 2.9%, respectively, in the same period. Currently, XOM and BP have implied volatilities of 12.8% and 13.7%, respectively. XOM and BP’s stock prices fell 5.0% and 0.3%, respectively, but Chevron’s stock price rose by 3.7% in the stated period.
However, the SPDR Dow Jones Industrial Average ETF (DIA) and the SPDR S&P 500 ETF (SPY), the broader market indicators, have shown mixed trends in their implied volatilities. DIA rose 0.6%, but SPY fell 0.7% since July 3. DIA and SPY have implied volatilities of 8.8% and 8.5%, respectively. During the same period, since July 3, DIA and SPY witnessed a rise in their values by 2.3% and 1.1%, respectively.
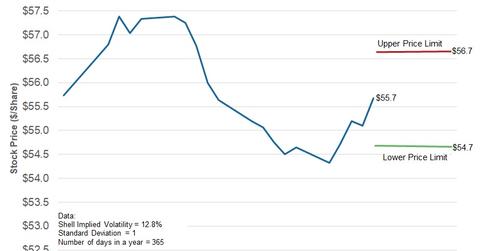
Forecasted price range for Shell stock for the seven-day period ending September 1
Considering Shell’s implied volatility of 12.8% and assuming a normal distribution of prices (bell curve model) and standard deviation of one (with a probability of 68.2%), Shell stock could close between $56.7 and $54.7 per share in the next seven calendar days ending September 1.
In the next part, we will review analyst ratings for Shell.
