What Does Nabors Industries’ Historical Valuation Suggest?
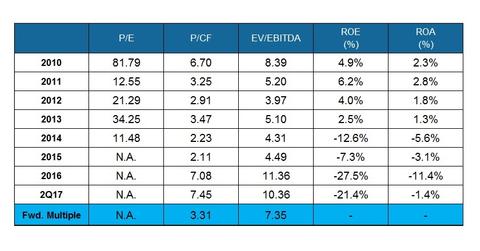
Nabors Industries’ PE multiple was not meaningful in 2015 and 2016 as a result of negative adjusted earnings during this period.
Aug. 22 2017, Updated 3:05 p.m. ET

Nabors Industries’ PE trend
On June 30, 2017, Nabors Industries’ (NBR) stock price was 50% lower than its price on December 30, 2016. Because NBR’s adjusted earnings were negative in 2Q17, its price-to-earnings (or PE) multiple was not meaningful in that quarter.
Nabors Industries’ PE multiple was not meaningful in 2015 and 2016 as a result of negative adjusted earnings during this period. Nabors Industries’ forward PE is not meaningful, reflecting analysts’ expectations of negative earnings for the next four quarters.
Nabors Industries comprises 0.12% of the iShares North American Natural Resources ETF (IGE). From December 30, 2016, to June 30, 2017, IGE fell 12%.
Nabors Industries’ price-to-cash-flow multiple
Nabors Industries’ (NBR) forward price-to-cash-flow (or PCF) multiple is lower than its 2Q17 PCF. This trend reflects analysts’ expectations of higher cash flows in the next four quarters.
Nabors Industries’ EV-to-EBITDA trend
In 2Q17, NBR’s enterprise value (or EV) decreased over 4Q16, which was primarily the result of NBR’s stock price decline during the same period. NBR’s historical valuation, which is expressed as its EV-to-EBITDA[1. enterprise value to earnings before interest, tax, depreciation, and amortization] multiple, decreased marginally in 2Q17 compared to 2016. NBR’s EV-to-EBITDA multiple in 2Q17 was higher than its past eight-year average EV-to-EBITDA multiple.
Nabors Industries’ forward EV-to-EBITDA multiple is lower than its 2Q17 multiple, which reflects analysts’ expectations of a higher adjusted EBITDA in the next four quarters. This is typically reflected in a higher current EV-to-EBITDA multiple compared to its historical average.
