Target’ s Performance as a Dividend Aristocrat
Target’s (TGT) sales for 2016 fell 6.0% due to lower comparable store sales and weak store traffic.
Aug. 16 2017, Updated 11:06 a.m. ET

Target: Services sector, discount variety store industry
Target’s (TGT) sales for 2016 fell 6.0% due to lower comparable store sales and weak store traffic. Lower SG&A (selling, general, and administrative) expenses contributed to growth in operating income. Rising interest expenses and gains on the sale of its pharmacy business in 2015 translated to a substantial fall in EPS (earnings per share). Target generates enough free cash flow to honor its dividend payments. However, it also participates in share repurchases. The company’s financial leverage and debt-to-equity ratio have seen a rising trend over the years.
We can see from the graph below that Target has recorded growth in its dividend yield. (Note that the asterisk in the graph denotes an approximation in calculating the dividends.)
Sales for 1Q17
Sales for 1Q17 fell slightly due to a weakness in its comparable sales and store traffic. The weakness in its top line led to a fall in operating income. However, lower interest expenses translated to an impressive growth in EPS.
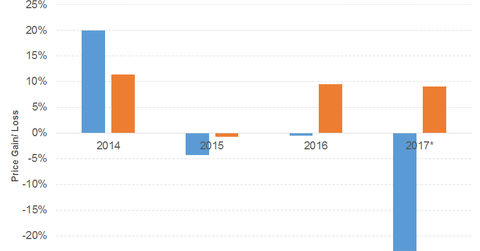
We can infer from the above graph that the prices have moved south since 2015. (Note that the asterisk in the graph denotes the price gain or loss to date.) The company is struggling to cope with the rapidly changing consumer dynamics, thus missing out on its earnings expectations. Weak economic growth in the United States and stronger rivals such as Walmart (WMT) and Amazon (AMZN) have forced the company to cut prices.
Target stock has fallen 23.5% on a YTD (year-to-date) basis.
Target’s PE (price-to-earnings) ratio of 12.1x compares to a sector average of 20.4x. Its dividend yield of 4.5% compares to a sector average of 2.3%.
