Consolidated Edison’s Dividend Trajectory
Consolidated Edison’s (ED) 2016 operating revenues fell 4.0% due to a decline in every segment; namely, electric, gas, steam, and non-utility.
Aug. 16 2017, Published 9:42 a.m. ET

Consolidated Edison: Utilities sector, electric utilities industry
Consolidated Edison’s (ED) 2016 operating revenues fell 4.0% due to a decline in every segment; namely, electric, gas, steam, and non-utility. Its lower operating expenses and a gain on the sale of a business translated to growth in operating income. The company recorded a rise in EPS (earnings per share) despite higher interest expenses. It doesn’t generate enough free cash flow to support its dividend payments. Its financial leverage has remained reasonably constant, and its debt-to-equity ratio has risen at a slow pace.
As you can see in the graph below, the company’s dividend yield has remained above the 3.0% mark despite the declining trend. (Note that the asterisk in the graph denotes an approximation in calculating the dividend.)
Operating revenues in the first half of the year
Operating revenues for the first half of 2017 fell slightly due to a decline in its electric and non-utility segments. Lower operating expenses contributed to its operating income and EPS growth despite higher interest expenses.
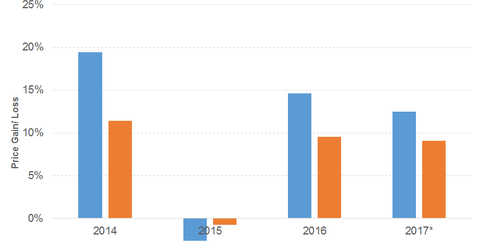
Consolidated Edison stock continues to beat the S&P 500, driven by the company’s profitability, as you can see in the above graph. (Note that the asterisk in the graph denoted the price gain or loss to date.)
The company has also beaten peers such as Southern Company (SO), as you can see in the graph below.
ED stock has risen 12.5% on a YTD (year-to-date) basis.
Consolidated Edison’s PE (price-to-earnings) ratio of 20.1x compares to a sector average of 64.6x. The company’s dividend yield of 3.3% compares to a sector average of 3.4%.
