Comparing Union Pacific’s Freight Volumes with the Industry in Week 33
In week 33 of 2017, Union Pacific (UNP) recorded a marginal rise of 0.6% in its railcars, excluding intermodal.
Nov. 20 2020, Updated 5:05 p.m. ET

UNP’s freight traffic in week 33
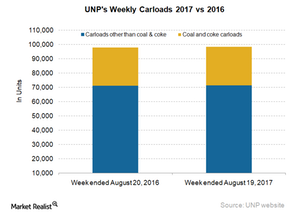
In week 33 of 2017, which ended on August 19, Union Pacific (UNP) recorded a marginal rise of 0.6% in its railcars, excluding intermodal. The company hauled 98,500 railcars in that week compared to ~98,000 units last year. Union Pacific’s railcars, excluding coal and coke, rose slightly 0.4% in the reported week to ~71,400 units, nearly equal with last year’s volumes.
US railroads reported a marginal rise in railcars in week 33 of 2017. Union Pacific registered a similar rise during the same week.
As with week 32, Union Pacific saw its coal (CNX) and coke carloads moving upward in the low single digits in the 33rd week of 2017. The company’s coal and coke traffic expanded 1.2% to 27,000 carloads in the same week compared with ~27,000 railcars in week 33 of 2016.
Berkshire Hathaway–controlled BNSF Railway is UNP’s rival in the Western US. BNSF’s coal and coke volumes were much higher in percentage terms compared with Union Pacific.
UNP’s intermodal volumes in week 33
In the week ended August 19, 2017, Union Pacific’s intermodal volume growth surged ahead of its rise in railcars. The company’s container and trailer volumes totaled 75,500 units in the same week compared with 72,000-plus units in the week ended August 20, 2016. While US railroads reported 8.2% volume growth in intermodal in week 33 of 2017, this metric was almost half for Union Pacific.
UNP’s container traffic usually exceeds 95% of overall intermodal traffic. In the 33rd week, container traffic was up 4.2% to ~73,000 units compared with ~70,000 containers a year before. The company’s trailer volume rose 5.8% to ~2,800 units in week 33 from ~2,700 trailers in the same week last year.
