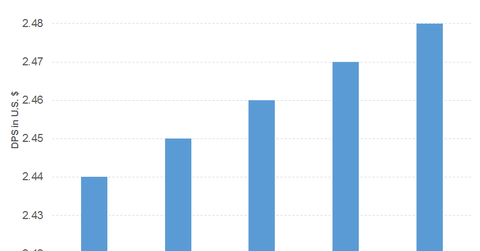
The Top Dividend-Growing Financial Sector Stocks
Mercury General (MCY) has consistently recorded revenue growth since fiscal 2011, except for a minor decline in fiscal 2015
July 12 2017, Published 2:44 p.m. ET

Mercury General
Mercury General (MCY) has consistently recorded revenue growth since fiscal 2011, except for a minor decline in fiscal 2015. That performance translated into a decline in EPS (earnings per share) for fiscal 2015. Property & Casualty Insurance recorded growth in the top and bottom lines for 1Q17, driven by net premium and net investment income. This performance boiled down to EPS growth. It has generated enough operating cash flow to honor its dividend commitments in the last five years and 1Q17.
The company maintains a good cash balance. Mercury General has a lower debt-to-equity ratio than Progressive Corp. (PGR). MCY’s stock price fell 9.8% on a year-to-date or YTD basis, mainly on flattening car sales and possibly even some evidence that a larger percentage of auto loans are defaulting. Since Mercury General mainly insures autos, it’s subject to any risk in this space.
Mercury General’s PE (price-to-earnings ratio) of 41.1x compares to a sector average of 36.2x. It offers a dividend yield of 4.6% against a sector average of 3.1%. Progressive offers a dividend yield of 1.5% at a PE of 25.5x.
Mercury General had a dividend payout ratio of 112.2% in fiscal 2016 compared to Progressive at 53.2%.
Old Republic International
Old Republic International (ORI) has recorded growth in its revenue since fiscal 2009. Survey & Title Insurance recorded EPS growth in the last two years. However, in 1Q17, the revenue growth was outweighed by claims and expenses. That difference led to a decline in EPS.
The company has generated enough operating cash flow to honor its dividend commitments in the last five years and 1Q17 barring fiscal 2014. It also maintains a reasonable cash balance. The company’s exceedingly low debt-to-equity ratio has risen gradually over the years and surpassed The Travelers Companies’ (TRV). Old Republic International’s stock price has risen 3% on a YTD basis.
Old Republic International’s PE of 12.4x compares to a sector average of 19x. The company offers a dividend yield of 3.9% against a sector average of 1.9%. Travelers Companies offers a dividend yield of 2.3% at a PE of 12.4x.
Old Republic International had a dividend payout ratio of 50.2% in fiscal 2016 compared to Travelers Companies at 26%.
T. Rowe Price
T. Rowe Price (TROW) has recorded consistent growth in revenue since fiscal 2010. The same can be said for EPS growth. Asset Management recorded top- and bottom-line growth in 1Q17 as well. The company has always generated enough free cash flow to honor its dividend obligations in the last five years and 1Q17 barring fiscal 2016. The debtless company has maintained a strong cash balance.
T. Rowe Price’s stock price has risen 1.2% on a YTD basis.
T. Rowe Price’s PE is 16x. The company offers a dividend yield of 3% against a sector average of 4.7%. Blackstone Group (BX) offers a dividend yield of 7.2% at a PE of 21.1x. Blackstone Group had dividend payout ratio of 139.2% compared to T. Rowe Price at 48.3% in FY16.
