Oil Rigs: Oil Prices Could Make a U-Turn
The US oil rig count extended to 765 in the week ending July 14, 2017—a gain of two rigs compared to the previous week.
July 19 2017, Published 12:53 p.m. ET

Oil rig data
The US oil rig count extended to 765 in the week ending July 14, 2017—a gain of two rigs compared to the previous week. In the trailing year, the US oil rig count more than doubled, while US crude oil prices only rose 2.6%. Oil bulls used the slower rise in the rig count to push prices higher.
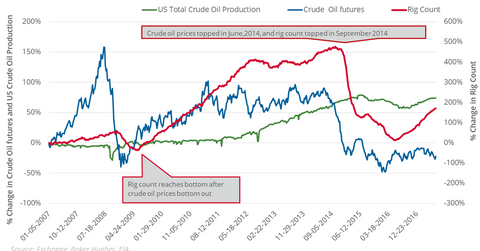
As of July 18, 2017, US crude oil (USO) (DBO) (USL) active futures fell 56.6% from their post-crisis high in June 2014. During this period, the oil rig count fell 50.5%. More than a 50% fall in oil prices capped US crude oil production at 2.2% below their record high of 9.6 million barrels per day in the week ending June 5, 2015.
Pattern between oil rigs and prices
Between 2007 and 2017, oil prices’ tops and bottoms were three to six months away from the oil rig count’s highs and lows. Moves in oil prices usually preceded the oil rig count.
In December 2008, oil prices fell to a multiyear low. In June 2009, the oil rig count also fell to a multiyear low.
On February 11, 2016, US crude oil prices made a 12-year low. The oil rig count fell to a multiyear low of 316 in the week ending May 27, 2016. Since then, oil prices rose 77.8%, while the oil rig count rose by 449.
On July 17, 2017, the EIA released its Drilling Productivity Report. It estimates that in August 2017, new oil production per rig could rise 27.8%—compared to the level in August 2016. So, a rise in the rig efficiency and oil rig count could boost crude oil production and undo oil’s gains. The analysis is also important for ETFs such as the Fidelity MSCI Energy ETF (FENY) and the Guggenheim S&P 500 Equal Weight Energy ETF (RYE).
