Estimating BP’s Stock Price Using Implied Volatility
What is implied volatility? Volatility gauges changes in a stock’s return over a period. When estimated based on historical stock prices, it is called historical volatility. We can estimate the future volatility, or implied volatility, of security using an option pricing model. A high implied volatility would indicate that a stock price is expected to move […]
July 14 2017, Updated 9:05 a.m. ET

What is implied volatility?
Volatility gauges changes in a stock’s return over a period. When estimated based on historical stock prices, it is called historical volatility.
We can estimate the future volatility, or implied volatility, of security using an option pricing model. A high implied volatility would indicate that a stock price is expected to move sharply, thereby providing higher positive or negative returns. Contrarily, with low implied volatility, lower positive or negative returns can be expected.
Comparing BP’s implied volatility
BP’s implied volatility rose from 17.3% on April 6, 2017, to 19.3% on July 6, 2017. During the same period, BP stock fell 0.4%. Similarly, Royal Dutch Shell’s (RDS.A) implied volatility rose 5.6% to 22.0%, and ExxonMobil’s (XOM) and Chevron’s (CVX) implied volatility rose 3.1% and 2.5%, respectively, to 16.2% and 18.3% on July 6. Royal Dutch Shell’s and Chevron’s stock prices rose 0.9% and 0.2%, respectively, whereas ExxonMobil stock fell 2.9%.
The SPDR Dow Jones Industrial Average ETF’s (DIA) and the SPDR S&P 500 ETF’s (SPY) implied volatility rose 1.3% and 0.8%, respectively, to 9.3% and 9.9% on July 6. During the same period, DIA and SPY each rose 3%.
Expected price range for BP stock
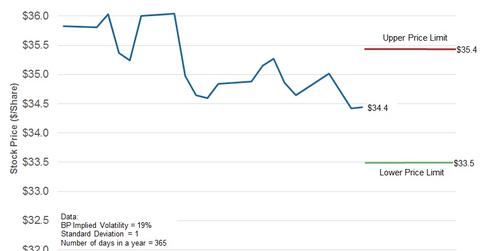
Considering BP’s implied volatility of 19.3% and assuming a normal distribution of prices, a standard deviation of one, and a probability of 68.2%, BP stock price could close between $35.40 and $33.50 per share in the next eight calendar days. In the next part, we’ll review which institutions are buying or selling BP stock.
