Dividend Growth for Qualcomm and Crown Castle International
Qualcomm (QCOM) recorded a year-over-year decline in revenues for 2Q17 after growth in the preceding quarter.
July 7 2017, Published 11:49 a.m. ET

Communication equipment
In this article, we’ll look at the dividend growth trajectory of Qualcomm and Crown Castle International. Qualcomm (QCOM) recorded a year-over-year (or YoY) decline in revenues for 2Q17 after growth in the preceding quarter. This decline was driven by weaker demand for its chipset business. Its EPS (earnings per share) for both quarters fell following a decline in operating income.
Qualcomm recorded a YoY decline in revenues for 2016, offset by growth in its operating income and EPS. Unlike its 1Q17 results, Qualcomm recorded growth in free cash flow for 2Q17, driven by growth in its operating cash flow and a decline in capex. This was preceded by impressive growth in free cash flow for 2016 for the same reasons.
Qualcomm
Qualcomm (QCOM) recorded three-year and five-year annualized growth of 17% and 20%, respectively, and it recorded growth of 11.3% in 2016. The company is trading at a discount of 72% to its sector average PE multiple, and it has a dividend yield equivalent to 183% of the sector average dividend yield.
The chipmaker has recorded consistent growth in its dividend since 2003. Qualcomm’s payout ratio was 57.4% in 2016 and 70.7% on a TTM (trailing-12-month) basis.
Qualcomm is contemplating a partnership with Microsoft (MSFT) for the development of server chips to lower its costs and cement its position in the cloud computing market. The acquisition of NXP Semiconductors (NXPI) is expected to expand the company’s presence in the chipset business.
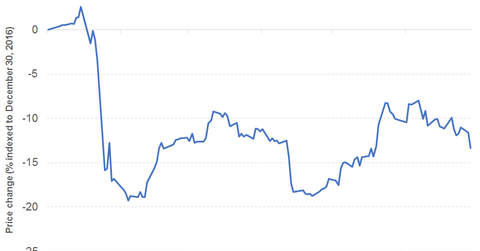
However, Qualcomm is confronted by legal and regulatory issues concerning its licensing model. A lawsuit was filed against the company in 2017 by Apple (AAPL) for allegedly unreasonable royalty fees. Qualcomm’s stock price fell 13.4% on a year-to-date basis, and it fell 2% on June 27, 2017.
Crown Castle International’s revenue growth
Crown Castle International (CCI) recorded revenue growth in 1Q17 and 2016, driven by higher demand for mobile data and leading to higher site rental revenues. This growth was followed by EPS (earnings per share) growth for 1Q17, in contrast to 2016 due to relatively stronger 2015 EPS growth.
Its free cash flow for 1Q17 recorded a YoY decline due to higher capex, offsetting the growth in operating cash flow. Its 2016 growth in free cash flow was driven by a decline in capex, offsetting the decline in operating cash flow.
Crown Castle International’s PE multiple
Crown Castle International (CCI) recorded growth of ~8% in 2016. The diversified communication services company is trading at a premium of 24% to its sector average PE multiple and has a dividend yield equivalent to 77% of the sector average dividend yield.
Crown Castle International started paying dividends in 2014 and had payout ratios of 361.2% and 313.7% for 2016 and on a TTM basis, respectively.
Strong 1Q17 results have led to an improved outlook for 2017. Crown Castle International’s stock price rose 19.8% on a year-to-date basis, and its price rose 2.2% on June 27. The acquisition of the privately held Wilcon Holdings is aimed at meeting the growing demand for high-speed and high-capacity wireless services.
The First Trust Value Line Dividend Index ETF (FVD) offers an annual dividend yield of 2% at a PE multiple of 21.4x. The PowerShares S&P 500 High Dividend Low Volatility Portfolio ETF (SPHD) is valued at 15.1x and offers an annual dividend yield of 3.7%.
