Analyzing Miners’ Correlation in July 2017
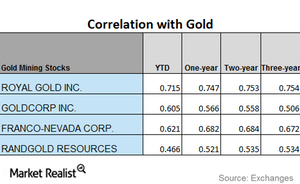
Royal Gold’s correlation fell from a three-year correlation of ~0.75 and a year-to-date correlation of ~0.72 with gold.
July 26 2017, Updated 2:51 a.m. ET

Mining stocks followed precious metals
It’s important for investors to analyze how mining companies’ daily fluctuations are related to the metals that they mine. In this part, we’ll look at the performance of Royal Gold (RGLD), Goldcorp (GG), Franco-Nevada (FNV), and Randgold Resources (GOLD) in relation to gold.
Funds such as the Physical Swiss Gold Shares (SGOL) and the Physical Silver Shares (SIVR) are also closely correlated with gold. These two funds had a five-day gain of 1.7% and 2.3%, respectively.
Correlation trends
All of the above-mentioned miners have shown a mixed trend in their correlation. However, Royal Gold has a clear downward trend.
An increase in the correlation is an indicator that a price fluctuation in gold could cause mining shares to move in the same direction. A decrease in the correlation suggests that it’s less likely that mining stocks would move in the same direction as gold.
Royal Gold’s correlation fell from a three-year correlation of ~0.75 and a year-to-date correlation of ~0.72 with gold. A correlation of ~0.72 means that the share price has moved alongside gold ~72% of the time in the past year. The correlation can move in different directions at different times.
