Rising Oil Rigs: Oil Bears’ Friend, Oil Bulls’ Foe
In the week ended June 16, 2017, the US oil rig count was 747, its highest level since the week ended April 17, 2015.
June 21 2017, Published 2:35 p.m. ET

22 weeks of consecutive rig count rises
In the week ended June 16, 2017, the US oil rig count was 747, its highest level since the week ended April 17, 2015. In April 2015, however, the average closing price for US crude oil active futures was $54.63 per barrel, compared to $45.91 per barrel in June 2017.
Even at lower prices, US shale drillers are adding rigs and drilling for more oil today than they were just a couple of years ago. This change could hint at improving exploration and production economics, which doesn’t bode well for oil prices.
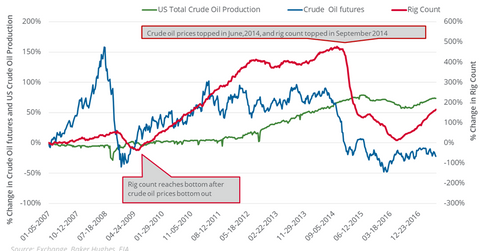
On a week-over-week basis, the oil rig count was six higher than it was in the week ended June 9, 2017. The oil rig count has risen for the last 22 consecutive weeks. From their highest closing price in June 2014, US crude oil futures fell 59.4%, while the oil rig count fell 51.7% during the same period.
In the week ended June 5, 2015, US crude oil production crossed 9.6 million barrels per day, a record high in terms of weekly production.
While the number of crude oil rigs is ~50% below its peak, current US oil production is just 2.9% below its peak.
US crude oil production
In the last decade, the tops and bottoms of crude oil prices and the oil rig count have occurred in three- to five-month gaps, with the oil rig count lagging.
For example, US crude oil (DBO) (USL) (UCO) active futures plunged to a multiyear low in February 2009, while the oil rig count fell to its bottom in May 2009. In a similar situation, US crude oil active futures tumbled to a 12-year low in February 2016, while the oil rig count fell to a multiyear low of 316 in the week ended May 27, 2016.
On June 20, 2017, US crude oil futures rose 66% compared to their 12-year low in February 2016 based on their closing price. US crude oil production rose 6.8% between May 27, 2016, and June 9, 2017, while the oil rig count rose 431 during the same period.
Rising rig efficiency
According to the EIA’s (U.S. Energy Information Administration) Drilling Productivity Report, new well oil production per rig could be 29.1% higher year-over-year in July 2017. This potential rise shows the effect of rising rig efficiency and explains how US shale producers are able to supply more oil even with fewer rigs.
The effect of the oil rig count via its effect on crude oil prices could affect energy ETFs such as the Fidelity MSCI Energy ETF (FENY) and the Guggenheim S&P 500 Equal Weight Energy ETF (RYE).
