How Has Boston Scientific Stock Performed Recently?
Boston Scientific (BSX) was trading at $27.9 on June 29, 2017.
Nov. 20 2020, Updated 1:33 p.m. ET

Stock performance
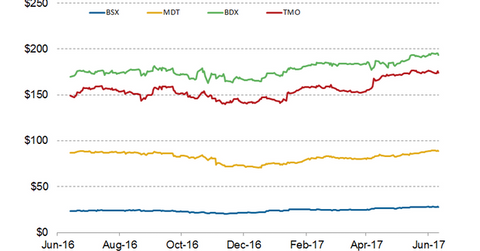
Boston Scientific (BSX) was trading at $27.9 on June 29, 2017. It has a 50-day moving average of $27.4 and a 200-day moving average of $25.1. The company’s 52-week low stands at $19.7, which was reported on December 1, 2016. The stock posted its 52-week high of $28.5 on June 19, 2017. As of June 30, 2017, Boston Scientific’s stock was trading ~42% above its 52-week low and approximately 2% below its 52-week high.
Boston Scientific stock has risen about 7.1% since its 1Q17 earnings release on April 27, 2017. The stock rose ~0.8% after the announcement of the company’s 1Q17 earnings on the day. For brief details about the earnings release, read Your Highlights of Boston Scientific’s 1Q17 Earnings.
As of June 30, 2017, Boston Scientific’s peers Medtronic (MDT), Becton Dickinson (BDX), and Thermo Fisher Scientific (TMO) generated returns of about 19.6%, 19.1%, and 28.5%, respectively, over the last 12 months.
Comparisons with industry and market performances
Boston Scientific has risen approximately 24.4% in the past 12 months. The stock returns have surpassed those of the SPDR S&P 500 Index (SPY), which returned ~18.8% during the same period. The company’s stock has gained significant upside triggered by a number of positive events. In February, Boston Scientific had fallen ~7% in premarket trading due to the Lots valve recall news. However, it was trading at its 52-week high on June 19, 2017, on the back of positive investor sentiment.
Boston Scientific has returned ~28.6% on a year-to-date basis, which compares to 8% and 25% year-to-date returns for SPY and the iShares US Medical Devices (IHI), respectively. IHI represents the US medical device sector.
