A Look at Patterson-UTI Energy’s Higher 2017 Capex Plan
Patterson-UTI Energy’s capex budget for 2017 is $450.0 million. That’s 275.0% higher than its 2016 capex.
June 8 2017, Updated 7:35 a.m. ET

Patterson-UTI Energy’s operating cash flow
Patterson-UTI Energy’s CFO (cash from operating activities) fell 95.0% in 1Q17 over 1Q16. PTEN generated $5.5 million in CFO in 1Q17. Despite higher revenues in the past year, lower working capital primarily led to lower CFO. PTEN’s 1Q17 CFO also fell compared to 4Q16.
Cash flow compared to peers
Fairmount Santrol Holdings’ (FMSA) 1Q17 CFO was $26.0 million. Helmerich & Payne’s (HP) 1Q17 CFO was ~$76.0 million, while Flotek Industries’ (FTK) was -$2.5 million. PTEN makes up 0.22% of the SPDR S&P MidCap 400 ETF (MDY). MDY rose ~16.0% in the past year, which is nearly the same as the rise in PTEN stock during the same period.
Patterson-UTI Energy’s free cash flow
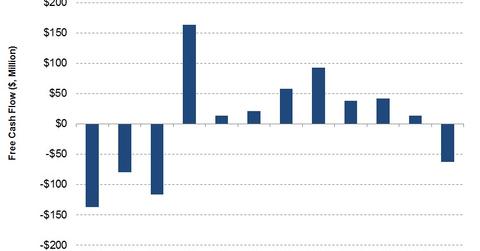
PTEN’s capex (capital expenditure) rose a substantial 221.0% in 1Q17 over a year ago. Capex exceeded PTEN’s CFO in 1Q17, which resulted in FCF (free cash flow) turning negative in 1Q17. Since December 2016, PTEN reactivated four spreads, which included two spreads that didn’t generate any revenues in 1Q17.
In 4Q16, PTEN’s FCF was -$63.0 million compared to $92.0 million a year ago. PTEN’s FCF has been negative in four of the past 13 quarters. FCF is CFO less capex.
Patterson-UTI Energy’s 2017 capex plan
Patterson-UTI Energy’s capex budget for 2017 is $450.0 million. That’s 275.0% higher than its 2016 capex. PTEN’s 2017 capex primarily includes rig upgrades and new builds, rig activation, and pressure pumping fleet activation and maintenance.
In the next part of this series, we’ll take a look at Patterson-UTI Energy’s dividends and dividend yields.
