What Does Basic Energy Services’ Historical Valuation Suggest?
On March 31, 2017, Basic Energy Services’ (BAS) stock price had fallen 6% from December 30, 2016.
Nov. 20 2020, Updated 3:35 p.m. ET

Basic Energy Services’ PE trend
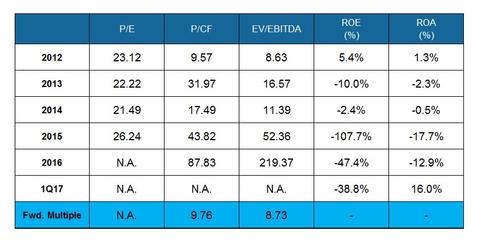
On March 31, 2017, Basic Energy Services’ (BAS) stock price had fallen 6% from December 30, 2016. However, in 1Q17, BAS’s adjusted earnings were negative. So, BAS’s price-to-earnings (or PE) multiple wasn’t meaningful in 1Q17. Basic Energy Services’ historical valuation, expressed as a PE multiple, was not meaningful in fiscal 2016 as a result of negative earnings.
Price-to-cash-flow multiple
From 4Q16 to 1Q17, BAS’s cash flow from operations (or CFO) turned negative. So, the price-to-cash-flow multiple wasn’t meaningful in 1Q17. Going forward, BAS’s price-to-cash-flow multiple is positive and lower than in fiscal 2016, which reflects analysts’ expectations of higher cash flow in the next 12 months.
Basic Energy Services’ EV-to-EBITDA trend
BAS’s adjusted EBITDA (or earnings before interest, tax, depreciation, and amortization) turned negative in 1Q17 compared to a quarter ago. In effect, the EV-to-EBITDA ratio wasn’t meaningful in 1Q17.
Forward EV-to-EBITDA multiple
Forward EV-to-EBITDA considers the sell-side analysts’ consensus estimate of EBITDA for the fiscal year. Basic Energy Services’ forward EV-to-EBITDA multiple for the next 12 months is lower than its 2016 EV-to-EBITDA multiple, which reflects analysts’ expectation of a higher EBITDA in the next 12 months. In fiscal 2016, adjusted EBITDA was higher than the past-seven-year average due to low EBITDA.
Peer comparison
In comparison, Schlumberger’s (SLB) forward EV-to-EBITDA stands at 14.1x, while Baker Hughes’s (BHI) forward EV-to-EBITDA multiple is 16.2x. Read more about oilfield service companies’ valuation in Market Realist’s Which Oilfield Services Giant Is Most Attractive after 1Q17? Patterson-UTI Energy’s (PTEN) forward EV-to-EBITDA is 8.5x. PTEN makes up 0.22% of the SPDR S&P MidCap 400 ETF (MDY).
Next, we’ll discuss Schlumberger’s valuation compared to its industry peers.
