Frontier Airlines Cut Costs and Became Profitable
Frontier Airlines earned 42% of its revenue from ancillary fees or non-ticket revenue in 2016—a significant rise compared to 25% in 2015.
April 5 2017, Updated 2:36 p.m. ET

Revenue growth and segmentation
Like low-cost carriers Spirit Airlines (SAVE) and Allegiant Travels (ALGT), Frontier Airlines also earned 42% of its revenue from ancillary fees or non-ticket revenue in 2016—a significant rise compared to 25% in 2015.
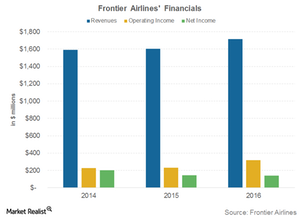
However, revenue growth has been slow. For 2016, revenue grew 6.9% YoY (year-over-year) to $1.7 billion—compared to $1.6 billion in 2015.
Lower costs
Due to major cost cutting by Frontier Airlines after the shift to a low-cost carrier model, costs fell drastically. Earlier, Frontier’s CASM (cost per available seat mile) was between legacy carriers like Delta Air Lines (DAL), American Airlines (AAL), and low-cost carriers. Today, it managed to bring the cost down lower than Spirit Airlines.
Excluding the fuel cost, Frontier’s CASM was at $0.05 in 2016—a significant reduction compared to $0.08 in 2013. It’s also lower than Spirit’s CASM ex-fuel of $0.06 in 2016.
Return to profitability
When Frontier Airlines was sold to Indigo partners in 2013, it recorded a loss of $6.4 billion for 1H13. It has come a long way thanks to the cost reduction we discussed earlier.
It recorded operating income of $317 million—36% YoY growth compared to $233 million recorded in 2015. It recorded a two-year CAGR (compound average growth rate) of 17.9%—compared to $228 million recorded in 2017.
The net income grew 37% YoY to $200 million—compared to $146 million in 2015. It has a two-year CAGR of 19.5%—compared to $140 million recorded in 2014.
The PowerShares Dynamic Leisure & Entertainment ETF (PEJ) invests ~5.0% of its portfolio in Southwest Airlines (LUV), ~5.0% in United Continental Holdings (UAL), 4.6% in Delta Air Lines (DAL) and American Airlines (AAL), and 2.8% in JetBlue Airways (JBLU).
