The Crude Oil Futures Spread, and Why It Could Worry Oil Longs
Active crude oil futures are now trading at a discount of $1.56 to futures contracts 12 months from now—a situation known as “contango.”
Nov. 20 2020, Updated 2:37 p.m. ET

Contango and oil prices
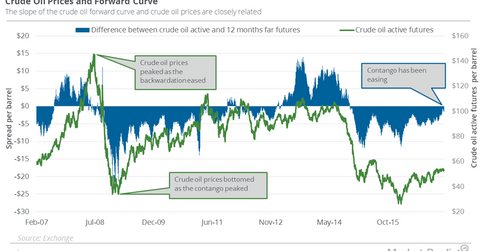
Active crude oil (USO) (USL) futures are now trading at a discount of $1.56 to futures contracts 12 months from now. This situation is referred to as “contango” in the crude oil futures market and is represented by an upward sloping shape on the futures forward curve.
Notably, such a contango situation indicates the market’s sentiment toward weak crude oil demand right now but also the likelihood of higher demand and higher prices in the future. On February 28, 2017, the spread was at $1.16.
Historically, periods of weak crude oil prices have coincided with the contango structure. The crude oil forward curve switched to the contango structure in November 2014. Since then, crude oil active futures have fallen ~32.6%.
Backwardation and oil prices
On the other hand, when there’s an immediate demand for crude oil, active crude oil futures trade at higher prices than the futures contracts for the months ahead. It causes the crude oil futures forward curve to slope downward. This situation in the crude oil futures market is referred to as “backwardation.”
Historically, periods of strong crude oil prices have coincided with a backwardation structure. Crude oil (SCO) (UCO) (DWTI) active futures closed at a historic high of $145.29 per barrel on July 3, 2008, after an almost one-year period of backwardation in the oil market.
Active crude oil futures traded at a premium of $9.24 to futures contracts 12 months ahead at the peak on November 2, 2007. As the forward curve switched to contango over the course of the following year—with active futures hitting a discount of $23.7 to futures contracts 12 months ahead in January 2009—crude oil prices lost 75.6%.
This means that the shape of the futures forward curve in the oil market could hint at coming changes in oil prices.
Impact of the crude oil forward curve
Since OPEC’s (Organization of the Petroleum Exporting Countries) historic deal, the contango structure in the oil market has been flattening. On February 23, 2017, WTI crude oil active futures were at their highest levels since July 6, 2015. However, due to rising US oil production and record oil inventory levels, the spread again started widening on February 23, 2017. Crude oil has lost 2.4% since then.
The dynamics of the crude oil forward curve can have implications on oil storage MLPs (master limited partnerships) (AMLP). They could impact upstream oil producers’ (XOP) hedging decisions. The fall in the spread could point to tightening in the crude oil demand-supply balance. It could mean that the market sees higher prices coming in the spot crude oil market. The opposite is also true. It could also mean that upstream producers have been hedging their future production at higher prices.
The dynamics of the forward curve also have important implications for the performance of commodity tracking ETFs such as the United States Oil (DBO) (USO) (OIIL). Due to the contango structure in the oil market lately, USO has underperformed crude oil prices. But this could change if the oil market switches to backwardation.
