What S&P 500 Index Moving Averages Could Indicate
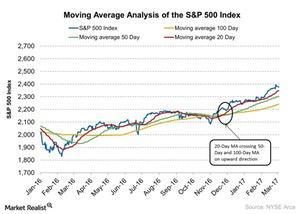
The S&P 500 Index is trading 1.2% above its 20-day moving average and 6% above its 100-day moving average.
Dec. 4 2020, Updated 10:53 a.m. ET

Rally in major US indexes
In the previous part of the series, we discussed that the market’s performance has improved since the US election, but that J.P. Morgan believes there might be a short-term pause in the market rally due to the Fed’s more hawkish tone. In this part, we’ll discuss what the moving averages are indicating for the S&P 500 Index (SPY) (QQQ) (IVV).
Moving averages of the S&P 500 Index   
The S&P 500 Index is trading 1.2% above its 20-day moving average and 6% above its 100-day moving average. On November 29, 2016, its 20-day moving average crossed its 100-day and 50-day moving averages in an upward direction. According to technical analysis, when short-term moving averages cross long-term moving averages in an upward direction, it’s usually indicative of an uptrend and vice versa.
The upward trend in the market is continuing in the present scenario. J.P. Morgan believes after this short-term pullout that the market may continue its upward trend. Strong fundamentals will drive the market in the long term. J.P. Morgan wrote, “over the medium-term, pro-growth policy reforms and solid fundamentals should likely result in higher equity values.”
The investment firm already provided a target level of 2,400 for the S&P 500 Index (IWM) (VOO) by the end of 2017. The index already touched 2,400 on March 1, 2017. However, the firm believes that in the long term, various policy changes and strong fundamentals will drive market movement.
In the next part of this series, we’ll analyze what the Fed’s possible rate hike means for the S&P 500 Index.
