How Does Chevron’s Stock Correlate with Oil Prices?
Correlation coefficient In this series, we’ve analyzed Chevron’s (CVX) Mafumeira Sul project, stock movement, dividend yield, PEG (price-to-earnings-to-growth), ratio, beta, short interest, implied volatility, institutional holdings, and valuation. In this part, we’ll see how Chevron’s stock correlates with oil prices. The correlation coefficient shows the relationship between two variables. A correlation coefficient value of zero […]
March 17 2017, Updated 10:35 a.m. ET

Correlation coefficient
In this series, we’ve analyzed Chevron’s (CVX) Mafumeira Sul project, stock movement, dividend yield, PEG (price-to-earnings-to-growth), ratio, beta, short interest, implied volatility, institutional holdings, and valuation. In this part, we’ll see how Chevron’s stock correlates with oil prices.
The correlation coefficient shows the relationship between two variables. A correlation coefficient value of zero to one shows a positive correlation, zero shows no correlation, and negative one to zero shows an inverse correlation. We’ve considered the price history of Chevron and WTI (West Texas Intermediate) over the past 12 months.
Chevron’s stock correlates with oil prices positively
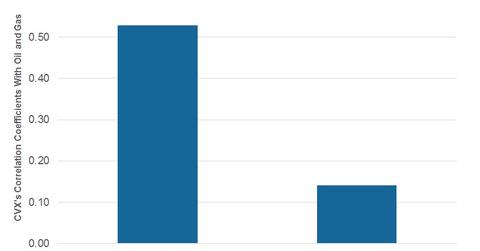
Integrated energy companies such as Chevron are affected due to crude oil price volatility. The scale of effect varies from company to company. Chevron’s correlation with WTI stands at 0.53, a strong positive correlation. On average, 53% of Chevron’s stock price movement can be explained by changes in WTI prices.
However, the strength of the correlation is lower for peer ExxonMobil (XOM). The correlation of XOM with WTI stands at 0.49. Suncor Energy (SU) shows a higher correlation with WTI of 0.65.
Downstream companies show a faint correlation with crude oil prices. Valero Energy (VLO), a refiner, has a 0.10 correlation with WTI.
Chevron and natural gas
Chevron’s correlation with natural gas is weaker, standing at 0.14, which could be due to Chevron’s production mix. The mix has a lower proportion of natural gas production, which natural gas making up 35% of total production and liquids comprising 65%.
If you’re looking for long-term growth and a broad-based exposure to the US market, you could consider the iShares Core S&P Total US Stock Market ETF (ITOT), which has ~6% exposure to the energy sector.
