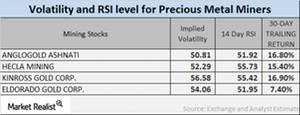
What the Latest Volatility and RSI Numbers Indicate
It’s important to monitor the implied volatilities of large mining stocks as well as their RSI levels, particularly after changes in precious metal prices.
Feb. 3 2017, Updated 7:38 a.m. ET

Precious metal funds
Precious metal mining stocks are known to closely track the performance of their respective precious metals. The SPDR S&P Metals and Mining ETF (XME) and the iShares MSCI Global Gold Miners ETF (RING) have risen 10.5% and 10.4%, respectively, YTD (year-to-date) as of January 26, 2017. Mining stocks often show more volatility than metals.
It’s important to monitor the implied volatilities of large mining stocks as well as their RSI (relative strength index) levels, particularly in the wake of the changes in precious metal prices. Now let’s focus on Kinross Gold (KGC), Alacer Gold (ASR), IamGold (IAG), and Harmony Gold (HMY).
Implied volatility
Call implied volatility takes into account the changes in an asset’s price due to variations in the price of its call option. During times of global and economic turbulence, volatility is higher than in a stagnant economy.
The volatilities of Kinross Gold, Alacer, IamGold, and Harmony Gold were 16.9%, 17%, 25.1%, and 14.2%, respectively, on January 26, 2017.
RSI levels
Notably, a 14-day RSI level of more than 70 indicates the possibility of a downward movement in price, whereas a level below 30 indicates the possibility of an upward movement.
The RSI levels for each of these four mining giants have risen due to their rising share prices. Kinross Gold, Alacer, IamGold, and Harmony Gold have had recent RSI levels of 55.4, 47.8, 54.5, and 48, respectively.
