What’s Kellogg’s Updated Guidance for Fiscal 2016?
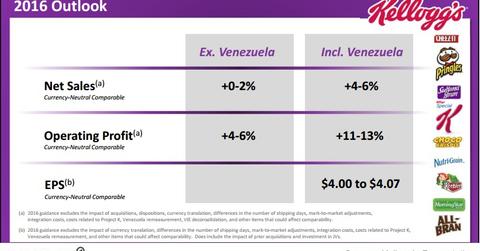
Kellogg (K) updated its fiscal 2016 guidance for currency-neutral comparable net sales, operating profit, and earnings per share.
July 29 2016, Updated 11:04 a.m. ET

Kellogg updated its fiscal 2016 guidance
Kellogg (K) updated its fiscal 2016 guidance for currency-neutral comparable net sales, operating profit, and earnings per share—due the better-than-expected performance by its Venezuelan business. Now, the company projects that it will exceed its long-term target of currency-neutral adjusted net sales and operating profit growth in fiscal 2016.
Net sales are expected to grow 4%–6%. It expects the operating profit to increase 11%–13%. Kellogg projects that due to the changes in its business in Venezuela, its fiscal 2016 adjusted net sales growth might be higher than the guidance range.
Savings from Project K
Kellogg is optimistic that it will generate savings from Project K and zero-based budgeting. This would result in an improved gross margin with a slight adverse effect from deflation. Interest expenses are estimated to be $235 million–$245 million. The adjusted effective tax rate is projected to be 27%–28%.
Incremental savings from Project K are still projected to be ~$100 million in fiscal 2016. Savings through zero-based budgeting are still expected to be ~$100 million. During the first quarter earnings release, the company also reaffirmed that it expects its fiscal 2016 operating cash flow to be ~$1.1 billion. Capital expenditure for the year would include the effect of the cash required by Project K and an increase in capital spending equal to ~1% of sales to support the growth of the Pringles business. Capital expenditure for the year is anticipated to be 4%–5% of sales.
What’s excluded from the guidance?
Not included in the guidance for net sales and operating profit are:
- the effect of mark-to-market adjustments
- acquisitions and dispositions
- costs related to Project K
- integration costs
- foreign currency translation
- remeasurement of the Venezuelan business
- other items that could impact comparability
Kellogg’s peers in the industry such as McCormick & Company (MKC), General Mills (GIS), and WhiteWave Foods (WWAV) reported a gross margin of 40.7%, 35.1%, and 34.0% in their last reported quarter, respectively. The PowerShares S&P 500 Quality Portfolio (SPHQ) invests 0.84% of its holdings in Kellogg.
In the next part of this series, we’ll look at what analysts recommend for Kellogg before its fiscal 2Q16 earnings.
