A Look at the Gold-Platinum Ratio
The demand for platinum has been very fragile over the past few years due to concerns about sales of diesel-based vehicles.
Feb. 27 2017, Updated 5:05 p.m. ET

Supportive European demand
The dollar has been one of the most important determinants in changes in the price of gold price. It has also played a crucial role in fluctuations of platinum-group metals such as platinum and palladium. Platinum is known mostly for its use in jewelry and as an autocatalyst for diesel-based automobile engines.
The demand for platinum has been very fragile over the past few years. Concerns surrounding the lower market forecast for sales of diesel-based vehicles have affected demand. The prices of gold and platinum were $1,250 and $1,009 per ounce, respectively, as of February 23, 2017.
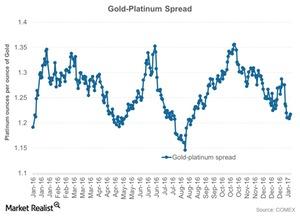
The above graph shows the performance of gold compared to platinum through the gold-platinum spread, or the gold-platinum ratio. The spread measures the number of platinum ounces it takes to buy an ounce of gold. The higher the ratio, the weaker platinum is compared to gold because more ounces of platinum are needed to buy a single ounce of gold.
RSI levels
The gold-platinum spread was ~1.2 on February 23, 2017. Platinum’s RSI (relative strength index) was 63.2. An RSI level above 70 indicates that an asset has been overbought and could fall. An RSI below 30 indicates that an asset has been oversold and could rise. The RSI for platinum is 53.2.
Fluctuations for these precious metals are closely reflected in funds such as the ETFS Physical Platinum (PPLT) and the ETFS Physical Swiss Gold (SGOL). Precious metal mining companies that rose in the past month due to the precious metal rebound include New Gold (NGD), Newmont Mining (NEM), Agnico-Eagle Mines (AEM), and Sibanye Gold (SBGL).
