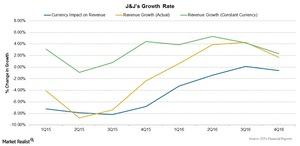
Changes in Johnson & Johnson’s Growth Rate in 4Q16
Johnson & Johnson (JNJ) reported a rise of ~2.3% in its revenue on a constant currency basis in 4Q16 compared to 4Q15.
Jan. 26 2017, Updated 1:35 p.m. ET

Johnson & Johnson’s growth rate
As discussed earlier, Johnson & Johnson (JNJ) reported a rise of ~2.3% in its revenue on a constant currency basis in 4Q16 compared to 4Q15. The company reported revenue of $18.1 billion in the quarter, missing analysts’ estimate of $18.3 billion.
For 2016, the company reported revenue of $71.9 billion, missing analysts’ estimate of $72.0 billion.
The above graph shows that foreign exchange rates had a constant negative impact on Johnson & Johnson’s growth rate in each quarter, mainly because nearly 48% of JNJ’s total revenue is reported from sales outside the United States. The company operates over 134 manufacturing facilities and eight innovation and research centers worldwide.
4Q16 performance
Johnson & Johnson’s revenue has risen over the past few years following the restructuring of its business segments and the strong performances of a few of its key products, including Xarelto, Zytiga, Remicade, Stelara, and Olysio, among others.
During 4Q16, the company reported operational growth across all of its segments. However, foreign exchange and Venezuela’s currency devaluation impacted its growth. The negative impact of foreign exchange surpassed the operational growth of the Consumer segment, causing a fall in its reported revenue.
We’ll discuss segment-wise revenues and performances and JNJ’s blockbuster drugs in the coming articles. JNJ’s key drug Stelara competes with Amgen’s (AMGN) and Pfizer’s (PFE) Enbrel and Abbott Laboratories’ (ABT) Humira. Its drug Zytiga competes with Dendreon’s (DNDN) Provenge.
Investors can consider ETFs such as the Fidelity MSCI Healthcare Index ETF (FHLC) which holds 8.8% of its total assets in Johnson & Johnson, in order to divest risk.
