Berry Plastics Acquired AEP Industries
In fiscal 2016, BERY reported net sales of $6.5 billion, a rise of 32.9% year-over-year.
Jan. 24 2017, Updated 7:39 a.m. ET

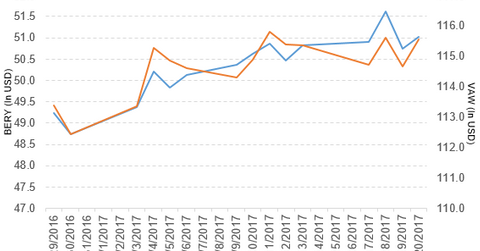
Price movement
Berry Plastics Group (BERY) has a market cap of $6.2 billion. It rose 0.53% to close at $51.02 per share on January 20, 2017. The stock’s weekly, monthly, and year-to-date (or YTD) price movements were 1.1%, -0.64%, and 4.7%, respectively, on the same day.
BERY is trading 1.5% above its 20-day moving average, 4.5% above its 50-day moving average, and 19.3% above its 200-day moving average.
Related ETF and peers
The Vanguard Materials ETF (VAW) invests 0.65% of its holdings in Berry Plastics. The YTD price movement of VAW was 2.8% on January 20.
The market caps of Berry Plastics’s competitors are as follows:
Latest news on BERY
Berry Plastics Group has completed its acquisition of AEP Industries Inc. (AEP).
The company reported, “Berry issued 6.5 million common shares and paid $297 million as merger consideration in exchange for all of the outstanding shares of AEP common stock and outstanding AEP equity awards. Additionally, Berry paid $164 million to retire outstanding AEP debt.
“Berry financed the cash consideration of the acquisition with a new $500 million 7-year term loan. Including the new shares issued, Berry’s outstanding common stock has increased to approximately 129 million shares, resulting in a market capitalization of approximately $6.5 billion.”
Performance of Berry Plastics in fiscal 4Q16
Berry Plastics reported fiscal 4Q16 net sales of $1.6 billion, a rise of 35.3% compared to net sales of $1.2 billion in fiscal 4Q15. The company’s operating margin expanded 40 basis points in fiscal 4Q16 compared to fiscal 4Q15.
Its net income and EPS (earnings per share) rose to $77.0 million and $0.61, respectively, in fiscal 4Q16 compared to $48.0 million and $0.39, respectively, in fiscal 4Q15. It reported adjusted EPS of $0.73 in fiscal 4Q16, a rise of 46.0% compared to fiscal 4Q15.
Fiscal 2016 results
In fiscal 2016, BERY reported net sales of $6.5 billion, a rise of 32.9% YoY (year-over-year). Its net income and EPS rose to $236.0 million and $1.89, respectively, in fiscal 2016 compared to $86.0 million and $0.70, respectively, in fiscal 2015.
Berry Plastics’s cash and cash equivalents and inventories rose 41.7% and 26.4%, respectively, in fiscal 2016. It reported adjusted free cash flow of $517.0 million in fiscal 2016, a rise of 18.6% YoY.
Projections
BERY has made the following projections for fiscal 2017:
- adjusted free cash flow of $550 million
- capital spending of $315 million
- cash interest costs of $275 million
Next, we’ll look at International Paper (IP).
