Analyzing the Gold-Platinum Ratio in 2017
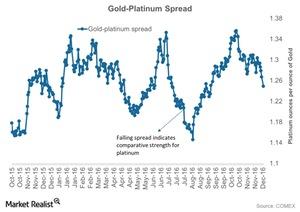
The gold-platinum spread was ~1.2 on January 11, 2017. Platinum’s RSI (relative strength index) was 38.
Jan. 27 2017, Updated 7:38 a.m. ET

Platinum rose after Trump’s win
Precious metals had a successful 2016 due to the Brexit vote in June, which shook global markets. Concerns continue to mount while haven bids for these assets rose, leading to rising prices.
Platinum also rose, particularly after Donald Trump won the US presidential election in November. However, the performance of platinum compared to other precious metals has been falling on a year-to-date basis.
Platinum also faced headwinds from a weaker South African rand, which makes it more profitable to produce platinum. Increasing production can also negatively impact prices.
The graph below shows the performance of gold compared to platinum by way of the gold-platinum spread, or the gold-platinum ratio. The spread measures the number of platinum ounces it takes to buy an ounce of gold. The higher the ratio, the weaker platinum is compared to gold, because more ounces of platinum are needed to buy a single ounce of gold.
RSI levels
The gold-platinum spread was ~1.2 on January 11, 2017. Platinum’s RSI (relative strength index) was 38. An RSI level above 70 indicates that an asset has been overbought and could fall. An RSI level below 30 indicates that an asset has been oversold and could rise.
Fluctuations in these precious metals are closely reflected in funds such as the ETFS Physical Platinum Shares ETF (PPLT) and the iShares Gold Trust ETF (IAU). Precious metal mining companies that fell in the past month include Eldorado Gold (EGO), Yamana Gold (AUY), Hecla Mining (HL), and New Gold (NGD).
