What Do the Key Metrics for TripAdvisor Suggest?
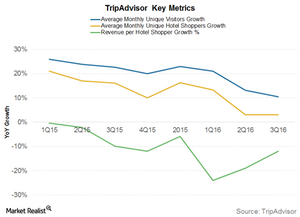
For 3Q16, TRIP’s revenue per shopper fell 12%. This is slightly better than the 24% decline seen in 1Q16 and the 19% decline seen in 2Q16.
Nov. 20 2020, Updated 1:07 p.m. ET

TripAdvisor sees flat growth in unique visitors
TripAdvisor’s (TRIP) average monthly unique visitors in 3Q16 grew 10.5% year-over-year (or YoY) to 388 million users compared to 3Q15. This is much slower than the 23% average growth seen in 2015 and 2Q16.
From 3Q15, TRIP started using its own log files to calculate unique visitors compared to its previous use of Google Analytics.
Hotel shoppers grow
Average monthly hotel shoppers for TripAdvisor grew 3% YoY to 153 million. This again significantly slower than the 13% growth seen in 2015. This slowing growth is a huge concern for TRIP as its Hotels segment forms almost 80% of its revenues.
Revenue per shopper declines
TRIP’s revenue per shopper also declined, which is another concerning trend. For 3Q16, TRIP’s revenue per shopper fell 12%. This is slightly better than the 24% decline seen in 1Q16 and the 19% decline seen in 2Q16. This was due to lower monetization on Instant Booking and phone, as well as the change in revenue recognition method. TRIP recognizes revenues at the time of stay rather than at the time of click.
However, revenues have started showing some green shoots. Transaction-based and click-based revenue per hotel shopper in the US increased throughout 3Q16.
Outlook
TripAdvisor’s (TRIP) unique visitors are expected to grow as more users shift to booking travel online and through mobile devices. For 2017, the company’s management plans to focus on growing revenues per hotel shopper—a key business metric. However, this seems to be easier said than done. As a result, TRIP has also reduced its margin guidance for 2017.
TripAdvisor forms 2% of the holdings of the First Trust Dow Jones Internet Index ETF (FDN), which also invests in Expedia (EXPE), but not in Priceline (PCLN) or Ctrip (CTRP).
