Why Did Breitbart Ask Its Readers to Boycott Kellogg?
Kellogg reported fiscal 3Q16 net sales of $3.25 billion—a fall of 2.4% from net sales of $3.33 billion in fiscal 3Q15 due to unfavorable currency headwinds.
Dec. 2 2016, Updated 1:04 p.m. ET

Price movement
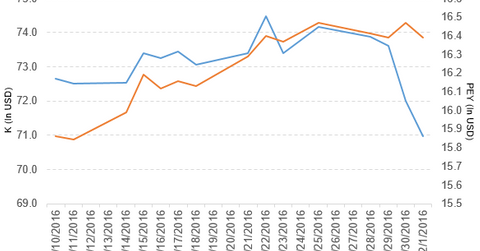
Kellogg Company (K) has a market cap of $24.9 billion. It fell 1.4% and closed at $70.96 per share on December 1, 2016. The stock’s weekly, monthly, and YTD (year-to-date) price movements were -2.6%, -5.0%, and 0.84%, respectively, on the same day. Kellogg is trading 3.2% below its 20-day moving average, 4.8% below its 50-day moving average, and 7.1% below its 200-day moving average.
Related ETF and peers
The PowerShares High Yield Equity Dividend Achievers Portfolio ETF (PEY) invests 1.5% of its holdings in Kellogg. PEY’s YTD price movement was 26.7% on December 1.
The market caps of Kellogg’s competitors are as follows:
Latest news
In a press release on December 1, 2016, Bloomberg reported, “Breitbart News urged its readers to boycott Kellogg Co. after the cereal maker stopped advertising on the news site, whose former chairman is a top adviser to President-elect Donald Trump.”
It also added, “Breitbart lashed back at the company following a statement that Kellogg wouldn’t put ads on sites that ‘aren’t aligned with our values.’ Breitbart Chief Executive Officer Larry Solov said the move was ‘un-American.’”
It noted, “’The only sensible response is to join together and boycott Kellogg’s products in protest,’ he said in a Breitbart story.”
Performance in fiscal 3Q16
Kellogg reported fiscal 3Q16 net sales of $3.25 billion—a fall of 2.4% from net sales of $3.33 billion in fiscal 3Q15 due to unfavorable currency headwinds. The company’s operating margin expanded by 260 basis points between fiscal 3Q15 and fiscal 3Q16 due to a reduction in selling, general, and administrative expenses.
Its net income and EPS (earnings per share) rose to $292.0 million and $0.82, respectively, in fiscal 3Q16—compared with $205.0 million and $0.58, respectively, in fiscal 3Q15. A reduction in one-time costs, the effective tax rate, and wider margins impacted its EPS. The company reported EPS of $0.96 in fiscal 3Q16—a rise of 12.9% over fiscal 3Q15.
Kellogg’s cash and cash equivalents rose 37.8% and its inventories fell 2.4% between fiscal 4Q15 and fiscal 3Q16. Its current ratio and long-term debt-to-equity ratio rose to 0.66x and 2.9x, respectively, in fiscal 3Q16—compared with 0.56x and 2.5x in fiscal 4Q15.
Projections
Kellogg made the following projections for fiscal 2016:
- currency-neutral comparable EPS of $4.16–$4.23
- currency-neutral comparable operating profit growth of 15.0%–17.0%
- currency-neutral comparable net sales growth below 4%
- cash flow of ~$1.1 billion
In the next part, we’ll look at Hasbro (HAS).
