Analyzing Halliburton’s Stock Price Returns
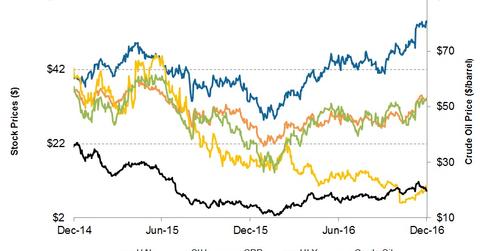
From December 2014 to December 2016, Halliburton’s (HAL) stock price reached the highest level in December 2016. It troughed at ~$28 in January 2016.
Dec. 27 2016, Updated 9:06 a.m. ET

Halliburton’s stock price returns
From December 2014 to December 2016, Halliburton’s (HAL) stock price reached the highest level in December 2016. It troughed at ~$28 in January 2016. Since then, as crude oil prices and the US rig count recovered, so did Halliburton stock. In the past two years, Halliburton stock produced ~38% returns.
Returns from Halliburton’s peers and the industry
Between December 2014 and December 2016, Halliburton’s lower market cap peer CARBO Ceramics’ (CRR) stock price fell 74%. During the same period, Halliburton’s other lower market cap peer Helix Energy Solutions Group’s (HLX) stock price return was -56%. In the past two years, returns from the VanEck Vectors Oil Services ETF (OIH) have been -8%. OIH is an ETF tracking an index of 25 OFS (oilfield equipment and services) companies. The crude oil price is down nearly 7% from December 2014 to December 2016.
OFS companies’ stock price movement
In the past two years, Halliburton outperformed the industry. Halliburton’s merger termination with Baker Hughes catapulted Halliburton in 2016. Investors should also note that the crude oil price recovery renewed merger and acquisition activity in the OFS space. The latest is Patterson-UTI Energy’s (PTEN) bid to acquire Seventy Seven Energy. To learn more, read Oilfield Services Deal: PTEN Will Acquire Seventy Seven Energy.
Learn more about the OFS industry, read The Oilfield Equipment and Services Industry: A Primer.
