How Refining Margins Are Key Indicators of Refining Profitability?
Refining margins are dependent on input crude oil cost, product slate, and prices of refined products and are indicators of overall profitability.
Nov. 14 2016, Published 3:02 p.m. ET

Indicators of refining profitability: GRMs and crack spreads
The GRM (gross refining margin) of a refining company is derived by subtracting the cost of crude oil it consumes from the total market value of refined products it produces. Refining margins are thus dependent on input crude oil cost, product slate, and prices of refined products. In this sense, the refining margin is an indicator of the overall profitability of a company’s refining operations.
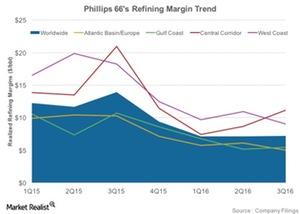
The chart below shows the refining margins for various regions as well as the worldwide refining margin for Phillips 66 (PSX) during the 1Q15–3Q16 period. The average worldwide GRM for PSX stood at $7.3 per barrel in 3Q16, which is down by $5 per barrel from 1Q15. PSX thus earned $7.3 per barrel from the sale of its refined products after deducting the input crude oil cost.
To determine the profitability of refining an individual product, however, a crack spread is calculated. A crack spread is arrived at by deducting the cost of crude oil from the value of each refined product. Hence, tracking GRMs and crack spreads can also point toward the profitability of a company’s refining operations.
Tracking refining margins and crack spreads
Investors should monitor GRMs and crack spreads in the regions where a company’s refineries are located. For example, PSX and Marathon Petroleum (MPC) have a large portion of their refining capacities on the US Gulf Coast, and tracking these companies’ Gulf Coast GRMs can hint at the profitability of each company.
Investors can also consider benchmarks like the 3-2-1 crack spread. According to the EIA (US Energy Information Administration), the 3-2-1 crack spread is derived by subtracting the cost of three barrels of crude oil from the combined value of two barrels of gasoline and one barrel of distillate. If investors track the US Gulf Coast WTI (West Texas Intermediate) 3-2-1 crack, they can understand the direction of refining margins for refiners like PSX and MPC in the near-term.
For exposure to refining stocks, investors can consider the iShares North American Natural Resources ETF (IGE), which ETF has ~6% exposure to refining and marketing sector stocks.
