Newell Brands Plans Its Growth Strategies
In 2Q16, Newell Brands’s net income and earnings per share fell to $135.2 million and $0.30, respectively, compared with $148.5 million and $0.55, respectively, in 2Q15.
Nov. 20 2020, Updated 1:35 p.m. ET

Price movement
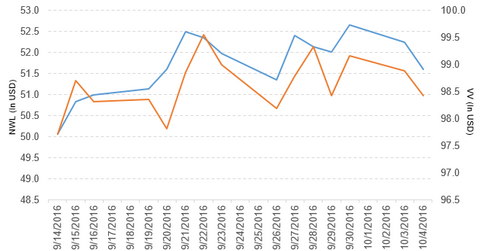
Newell Brands (NWL) has a market cap of $24.6 billion. It fell 1.2% to close at $51.60 per share on October 4, 2016. The stock’s weekly, monthly, and year-to-date (or YTD) price movements were -1.5%, -3.7%, and 18.5%, respectively, on the same day.
NWL is trading 0.29% below its 20-day moving average, 1.8% below its 50-day moving average, and 13.0% above its 200-day moving average.
Related ETF and peers
The Vanguard Large-Cap ETF (VV) invests 0.12% of its holdings in Newell Brands. The ETF tracks a market cap–weighted index that covers 85% of the market capitalization of the US equity market. The YTD price movement of VV was 6.9% on October 4.
The market caps of Newell Brands’s competitors follow:
Latest news on Newell Brands
Newell Brands (NWL) recently announced several growth strategies.
On October 4, the company reported, “Newell Brands will transform from a holding company to an operating company and, with a new set of investment priorities and a sharpened set of portfolio choices, accelerate growth and performance by deploying a proven set of growth capabilities over a broader set of categories and by disproportionately resourcing the business with the greatest potential.”
The report added, “The company will simplify its operating structures consolidating the existing 32 Business Units to 16 Operating Divisions, including the creation of a new global enterprise-wide e-Commerce Division.”
The report continued, “The company will also focus and strengthen its portfolio by holding a number of businesses for sale, using the proceeds primarily to accelerate debt pay down, and creating a platform for future acquisitions that strengthen and scale the company’s core businesses.”
Newell Brands added, “The businesses held for sale represent about 10 percent of the portfolio and include the vast majority of the Tools Segment, the Winter Sports business within the Outdoor Solutions Segment, the Heaters, Humidifiers, and Fans businesses within the Consumer Solutions Segment, and the Consumer Storage Container business within the Home Solutions Segment.”
Performance of Newell Brands in 2Q16
Newell Brands (NWL) reported 2Q16 net sales of $3.9 billion, a rise of 143.8% over its net sales of $1.6 billion in 2Q15. Sales from its Writing and Baby and Parenting segments rose 15.8% and 12.4%, respectively. Sales from its Home Solutions, Tools, and Commercial Products segments fell 1.1%, 3.8%, and 7.9%, respectively, between 2Q15 and 2Q16.
NWL reported a loss related to the extinguishment of its debt-credit facility of $1.2 million in 2Q16. The company’s gross profit margin and operating income fell 28.6% and 35.9%, respectively, between 2Q15 and 2Q16.
In 2Q16, Newell Brands’s net income and EPS (earnings per share) fell to $135.2 million and $0.30, respectively, compared with $148.5 million and $0.55, respectively, in 2Q15. It reported non-GAAP[1. generally accepted accounting principles] normalized EPS of $0.78 in 2Q16, a rise of 21.9% over 2Q15.
In 2Q16, NWL reported cash and cash equivalents and inventories of $627.3 million and $2.9 billion, respectively, compared with $238.7 million and $935.6 million, respectively, in 2Q15. In 2Q16, its current ratio rose to 1.6x and its long-term debt-to-equity ratio fell to 1.1x, compared with 1.1x and 1.2x, respectively, in 2Q15.
Projections
Newell Brands (NWL) reaffirmed the following projections for fiscal 2016:
- core sales growth in the range of 3.0%–4.0%
- normalized EPS in the range of $2.75–$2.90
- an effective tax rate in the range of 29%–30%
For an ongoing analysis of this sector, please visit Market Realist’s Consumer Discretionary page.
