A Look at Harley-Davidson’s 3Q16 Performance
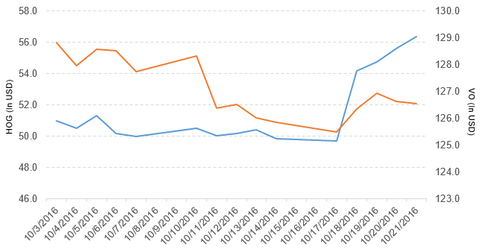
Price movement Harley-Davidson (HOG) rose 13.1% to close at $56.37 per share during the third week of October 2016. The stock’s weekly, monthly, and year-to-date (or YTD) price movements were 13.1%, 8.5%, and 27.2%, respectively, as of October 21. HOG is trading 9.2% above its 20-day moving average, 8.1% above its 50-day moving average, and […]
Oct. 25 2016, Updated 11:05 a.m. ET

Price movement
Harley-Davidson (HOG) rose 13.1% to close at $56.37 per share during the third week of October 2016. The stock’s weekly, monthly, and year-to-date (or YTD) price movements were 13.1%, 8.5%, and 27.2%, respectively, as of October 21. HOG is trading 9.2% above its 20-day moving average, 8.1% above its 50-day moving average, and 19.9% above its 200-day moving average.
Related ETF and peers
The Vanguard Mid-Cap ETF (VO) invests 0.27% of its holdings in Harley-Davidson. VO tracks the CRSP US Mid-Cap Index, a diversified index of mid-cap US companies. VO’s YTD price movement was 6.4% on October 21.
The market caps of Harley-Davidson’s competitors are as follows:
Performance of Harley-Davidson in fiscal 3Q16
Harley-Davidson reported fiscal 3Q16 motorcycle and related products revenue of $1.09 billion, a fall of 4.4% from the $1.14 billion reported in fiscal 3Q15. It reported motorcycle shipments of 48,611 in fiscal 3Q16, a fall of 9.1% from fiscal 3Q15. The company’s retail sales in the Americas region fell 6.6%, and retail sales in the EMEA (Europe, the Middle East, and Africa) Asia-Pacific regions rose 2.0% and 1.7%, respectively, between fiscal 3Q15 and fiscal 3Q16. The company’s gross profit and operating margins of motorcycles and related products fell 100 basis points and 260 basis points, respectively.
Its financial services revenue rose to $183.2 million in fiscal 3Q16, a rise of 3.4% over 3Q15. Its net income and EPS (earnings per share) fell to $114.1 million and $0.64, respectively, in fiscal 3Q16, compared with $140.3 million and $0.69, respectively, in fiscal 3Q15.
Harley-Davidson’s cash and cash equivalents and finance receivables rose 9.4% and 7.4%, respectively, and its inventories fell 27.2% between fiscal 4Q15 and fiscal 3Q16. Its current ratio rose to 1.6x, and its long-term debt-to-equity ratio fell to 2.60x in fiscal 3Q16, compared with 1.4x and 2.63x, respectively, in fiscal 4Q15.
During fiscal 3Q16, the company repurchased 2.1 million shares worth $104.6 million. As of September 25, 2016, 20.9 million shares remained under its share repurchase program.
Projections
Harley-Davidson has made the following projections for fiscal 2016:
- to ship 264,000 to 269,000 motorcycles, a growth of -1% to 1% over 2015
- operating margin in the range of ~15% to 16% for the motorcycles segment
- capital expenditure in the range of $255 million to $275 million
- effective tax rate of ~33%
In fiscal 4Q16, the company expects to ship 44,200 to 49,200 motorcycles. Next, we’ll look at PepsiCo (PEP).
