This Truckload Carrier’s Capital Expenditure Bucks the Trend
In the current weak freight regime, the extent of capital expenditure throws light on the growth prospects of these trucking carriers.
Sept. 15 2016, Updated 10:04 a.m. ET

US truckload carriers’ capital expenditures
Previously, we looked at the operating cash flows of some major US trucking companies. Now we’ll look at their capital expenditures.
In the current weak freight regime, the extent of capital expenditure throws light on the growth prospects of these carriers. In the trucking space, capital spending is usually less than what it is for railroads (UNP). Let’s evaluate these trucking companies’ capital investments based on a percentage of revenues.
Capex-to-revenues ratio
The capex (capital expenditure)-to-revenues ratio measures a trucking company’s level of investment in the future. This ratio compares capex to revenues in a given period. The higher the ratio per carrier, the better it is from a growth perspective. However, it may also be done to replenish an aged fleet. Although lower capex by trucking companies is a matter of growth concern, it may not always correct.
In the current low-freight era, the capacity for most of these major truckload carriers has reached the threshold. Again, the spot rate market, or the non-contract market, is very tight. So the possibility of a rate hike is distant for now. If shippers create their own private truck fleets to accommodate their schedules, then we might see reduced capital spending for trucking companies.
Capex: Werner Enterprises versus Swift Transportation
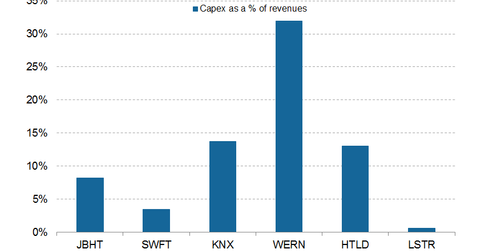
As you can see in the above graph, Werner Enterprises (WERN) has the highest capex-to-revenue ratio among the companies we’re covering in this series. The company’s ratio is 31.9%. It has invested $313.0 million in the first half of 2016 to reduce the average age of its truck fleet. As we’ve already seen, Landstar System (LSTR) operates in an asset-light environment, relying mainly on independent contractors to serve its customers. Its capex isn’t even 1% of its revenues.
Among the remaining truckers, Swift Transportation (SWFT) had the lowest capex of 3.5% as a percentage of revenues in the first half of 2016. The company has a sizable portion of its equipment under operating and capital leases. Since the company focused on fleet utilization, it didn’t add net capacity within its truck fleet in the first half of 2016.
For Knight Transportation (KNX), capex as a percentage of revenue was 13.8% in the first half of 2016. However, it was less compared to 2015. Heartland Express’s (HTLD) capital spending was 13.1% of its revenues in the first half of 2016. For JB Hunt Transport Services (JBHT), it was 8.2% for the same period.
ETF investments
Transportation and logistics companies form part of the industrial sector. Major US railroads (UNP) and airlines represent 5.5% and 4.9%, respectively, of the portfolio holdings of the iShares US Industrials (IYJ).
In the next part of the series, we’ll take a look at these trucking companies’ distributions to shareholders in terms of dividend payment.
