How Did PepsiCo Perform in 3Q16?
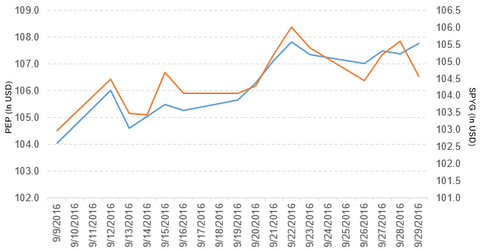
Price movement PepsiCo (PEP) has a market cap of $155.1 billion. It rose 0.35% to close at $107.76 per share on September 29, 2016. The stock’s weekly, monthly, and year-to-date (or YTD) price movements were -0.06%, 1.2%, and 10.2%, respectively, on the same day. PEP is trading 1.2% above its 20-day moving average, 0.57% above […]
Oct. 3 2016, Updated 8:06 a.m. ET

Price movement
PepsiCo (PEP) has a market cap of $155.1 billion. It rose 0.35% to close at $107.76 per share on September 29, 2016. The stock’s weekly, monthly, and year-to-date (or YTD) price movements were -0.06%, 1.2%, and 10.2%, respectively, on the same day. PEP is trading 1.2% above its 20-day moving average, 0.57% above its 50-day moving average, and 5.9% above its 200-day moving average.
Related ETFs and peers
The SPDR S&P 500 Growth ETF (SPYG) invests 0.91% of its holdings in PepsiCo. The ETF tracks an index of primarily large-cap growth stocks. The index selects companies from the S&P 500 based on three growth factors. The YTD price movement of SPYG was 5.2% on September 29.
The Consumer Staples Select Sector SPDR ETF (XLP) invests 4.6% of its holdings in PepsiCo. The ETF tracks a market-cap-weighted index of consumer staples stocks drawn from the S&P 500.
The market caps of PepsiCo’s competitors are as follows:
Performance of PepsiCo in fiscal 3Q16
PepsiCo reported fiscal 3Q16 net revenues of $16.0 billion, a fall of 1.8% from the net revenues of $16.3 billion reported in fiscal 3Q15. Revenue from Frito-Lay North America and North America beverages rose 3.4% and 2.9%, respectively, and revenues from Quaker Foods North America, Latin America, and Europe Sub-Saharan Africa fell by 2.1%, 22.8%, and 1.9%, respectively, between fiscal 3Q15 and fiscal 3Q16. The company’s gross profit margin and operating profit rose 0.72% and 99.2%, respectively.
Its net income and EPS (earnings per share) rose to $2.0 billion and $1.37, respectively, in fiscal 3Q16, compared with $533.0 million and $0.36, respectively, in fiscal 3Q15. It reported non-GAAP (generally accepted accounting principles) EPS of $1.40 in fiscal 3Q16, a rise of 3.7% from fiscal 3Q15
PEP’s cash and cash equivalents and inventories rose 12.8% and 14.7%, respectively, between fiscal 4Q15 and fiscal 3Q16. Its current ratio and debt-to-equity ratio rose to 1.32x and 4.81x, respectively, in fiscal 3Q16, compared with 1.31x and 4.79x, respectively, in fiscal 4Q15.
Projections
PepsiCo (PEP) made the following projections for fiscal 2016:
- core EPS of $4.78
- organic revenue growth of ~4%, which excludes the impact of a 53rd week and structural changes but includes the deconsolidation of the Venezuelan operations
- productivity savings of ~$1 billion
- more than $10 billion in cash flow from operating activities
- free cash flow of more than $7 billion, which excludes certain items
- net capital spending of ~$3 billion
- a return of ~$7 billion to its shareholders through dividends of ~$4 billion and share repurchases of ~$3 billion
Next, we’ll look at ConAgra Foods (CAG).
