How Did Ford Motor Perform in August 2016?
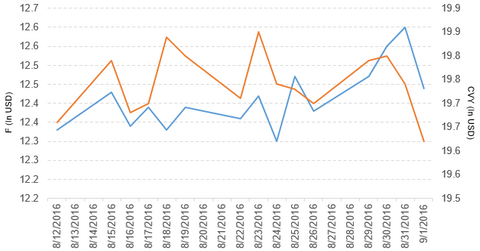
Ford Motor fell by 1.3% to close at $12.44 per share on September 1, 2016. Its weekly, monthly, and YTD price movements were -0.24%, 2.6%, and -6.7%.
Sept. 2 2016, Updated 5:04 p.m. ET

Price movement
Ford Motor (F) has a market cap of $49.8 billion. It fell by 1.3% to close at $12.44 per share on September 1, 2016. The stock’s weekly, monthly, and YTD (year-to-date) price movements were -0.24%, 2.6%, and -6.7%, respectively, on the same day.
Ford is now trading 0.70% above its 20-day moving average, 2.2% below its 50-day moving average, and 2.6% below its 200-day moving average.
Related ETFs and peers
The Guggenheim Multi-Asset Income ETF (CVY) invests 0.95% of its holdings in Ford. The ETF tracks the Zacks Multi-Asset Income Index and aims to outperform the Dow Jones US Select Dividend Index using US stocks, American depositary receipts, real estate investment trusts, master limited partnerships, closed-end funds, preferred stocks, and royalty trusts. The YTD price movement of CVY was 9.2% on September 1.
The First Trust Large Cap Value AlphaDex ETF (FTA) invests 0.83% of its holdings in Ford Motor. The ETF tracks an index that selects and weights value stocks from the S&P 500 Value Index using fundamental factors including sales, book value, and cash flows.
The market caps of Ford Motor’s competitors are as follows:
Sales of Ford Motor in August 2016
Ford Motor reported total vehicles sales of more than 214,000 units, which is a fall of 8.4% from August 2015. Below is a sales-by-brand breakdown:
- Ford brand reported sales of just over 205,000 units, which represents a fall of 9.0% from August 2015. This includes the Focus, Explorer, Escape, and F-Series trucks models, whose sales fell by 27.9%, 15.5%, 2.8%, and 6.1%, respectively. Sales of transit trucks rose by 16.9%.
- Lincoln brand reported sales of 9,243 units, which represents a rise of 7.0% from August 2015 and includes MKZ cars and MKX SUVs sales rose by 7.1% and 49.9%, respectively.
The following is a breakdown of Ford’s sales by type:
- Cars reported sales of ~52,000 units, which is a fall of 25.4% from August 2015.
- SUVs reported sales of nearly 74,000 units, which is a fall of 0.84% from August 2015.
- Trucks reported sales of over 88,000 units, which is a fall of 1.6% from August 2015.
Now we’ll look at General Motors.
