Ball Corporation Is Selling Its Specialty Tin Facility
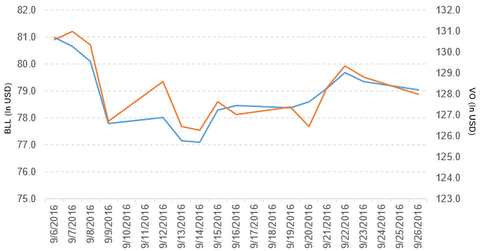
Ball Corporation (BLL) has a market cap of $13.8 billion. It fell 0.38% to close at $79.04 per share on September 26.
Sept. 27 2016, Published 12:47 p.m. ET

Price movement
Ball Corporation (BLL) has a market cap of $13.8 billion. It fell 0.38% to close at $79.04 per share on September 26. The stock’s weekly, monthly, and year-to-date (or YTD) price movements were 0.85%, -0.81%, and 9.3%, respectively, on the same day. BLL is trading 0.07% above its 20-day moving average, 2.8% above its 50-day moving average, and 9.9% above its 200-day moving average.
Related ETF and peers
The Vanguard Mid-Cap ETF (VO) invests 0.33% of its holdings in Ball Corporation. The ETF tracks the CRSP US Mid-Cap Index, a diversified index of midcap US companies. The YTD price movement of VO was 7.7% on September 26.
The market caps of Ball’s competitors are as follows:
Latest news on Ball
In a press release on September 26, Ball reported, “Ball Corporation (BLL) today announced an agreement to sell its specialty tin manufacturing facility in Baltimore, Maryland, to US-based Independent Can Company for approximately $25 million.”
It added, “The transaction is expected to close during the fourth quarter of 2016 and the proceeds are subject to customary closing adjustments.”
Performance of Ball Corporation in 2Q16
Ball Corporation reported 2Q16 net sales of $2.0 billion, a fall of 9.1% compared to net sales of $2.2 billion in 2Q15. Sales of metal beverage packaging in the Americas and Asia, metal beverage packaging in Europe, food and aerosol packaging, and aerospace fell 7.0%, 0.42%, 10.2%, and 16.1%, respectively, in 2Q16 compared to 2Q15. It reported business consolidation and other activities expense of $16.0 million in 2Q16 compared to $66.0 million in 2Q15. The company’s cost of sales as a percentage of net sales and EBIT (earnings before interest and taxes) fell by 2.2% and 2.6%, respectively, in 2Q16 compared to the prior year period.
The company reported business consolidation and other activities expense of $16.0 million in 2Q16 compared to $66.0 million in 2Q15. The company’s cost of sales as a percentage of net sales and EBIT (earnings before interest and taxes) fell 2.2% and 2.6%, respectively, in 2Q16 compared to the prior year period.
Its net income and EPS (earnings per share) rose to $369.0 million and $2.54, respectively, in 2Q16 compared to $160.0 million and $1.13, respectively, in 2Q15. It reported adjusted EPS of $1.05 in 2Q16, a rise of 18.0% compared to 2Q15.
Ball’s net receivables and net inventories rose 59.3% and 59.6%, respectively, in 2Q16 compared to 2Q15. It reported cash and cash equivalents of $6.4 billion in 2Q16 compared to $227.0 million in 2Q15. Its current ratio and long-term debt-to-equity ratio fell to 1.0x and 2.1x, respectively, in 2Q16 compared to 1.1x and 2.2x, respectively, in 2Q15.
The company has projected free cash flow in the range of $750 million to $850 million for 2017.
In the next part of this series, we’ll take a look at Drew Industries (DW).
