Mohawk Industries’ Earnings Results in Fiscal 2Q16
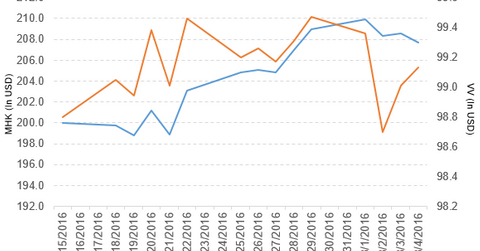
Mohawk Industries (MHK) has a market cap of $15.3 billion. It fell by 0.42% to close at $207.70 per share on August 4, 2016.
Aug. 8 2016, Published 3:52 p.m. ET

Price movement
Mohawk Industries (MHK) has a market cap of $15.3 billion. It fell by 0.42% to close at $207.70 per share on August 4, 2016. The stock’s weekly, monthly, and year-to-date (or YTD) price movements were 0.34%, 10.2%, and 9.7%, respectively, on the same day. MHK is trading 3.1% above its 20-day moving average, 5.6% above its 50-day moving average, and 10.4% above its 200-day moving average.
Related ETF and peers
The Vanguard Large-Cap ETF (VV) invests 0.06% of its holdings in Mohawk Industries. The ETF tracks a market-cap-weighted index that covers 85% of the market capitalization of the US equity market. The YTD price movement of VV was 7.0% on August 4.
The market caps of Mohawk Industries’ competitors are as follows:
Performance of Mohawk Industries in fiscal 1Q16
Mohawk Industries reported fiscal 2Q16 net sales of $2.3 billion, a rise of 15.0% from the net sales of $2.0 billion in fiscal 2Q15. Sales from the global ceramic, flooring NA, and flooring ROW segments rose by 5.1%, 6.6%, and 50.7%, respectively, between fiscals 2Q15 and 2Q16. The company’s gross profit margin and operating income rose by 8.6% and 37.1%, respectively.
Its net income and EPS (earnings per share) rose to $255.2 million and $3.42, respectively, in fiscal 2Q16, compared with $186.5 million and $2.53, respectively, in fiscal 2Q15. It reported adjusted EPS of $3.47 in fiscal 2Q16, a rise of 29.0% from fiscal 2Q15.
Mohawk’s cash and cash equivalents fell by 34.5%, and its inventories rose by 4.3% between fiscals 2Q15 and 2Q16. Its current ratio and debt-to-equity ratio fell to 1.1x and 0.91x, respectively, in fiscal 2Q16, compared with 1.2x and 1.2x, respectively, in fiscal 2Q15.
The company has projected EPS in the range of $3.40 to $3.49 per share, which excludes any restructuring charges, for fiscal 3Q16. In the next part of this series, we’ll discuss Ball’s performance in 2Q16.
