How Does Wells Fargo Compare with JPMorgan Chase on Profitability?
JPMorgan Chase (JPM) and Wells Fargo (WFC) reported profits of $6.2 billion and $5.6 billion, respectively, in the most recent quarter.
Aug. 24 2016, Updated 10:04 a.m. ET

Profitability
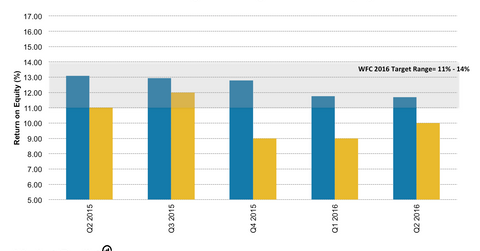
JPMorgan Chase (JPM) and Wells Fargo (WFC) reported profits of $6.2 billion and $5.6 billion, respectively, in the most recent quarter. However, what stands out is that Wells Fargo generated these profits with 25% fewer assets than JPMorgan Chase.
This efficiency has helped Wells Fargo generate a return on equity of 11.7%, significantly higher than JPMorgan Chase’s return on equity of 10%.
Revenue comparison
In 2Q16, JPMorgan Chase’s revenues grew by 3% to $25.2 billion, while revenues of Wells Fargo (WFC) grew by 4% year-over-year to $22.2 billion.
Net interest margins
JPMorgan Chase’s net interest income increased by 6% to $11.7 billion. Its net interest margin increased by 13 basis points year-over-year to 2.13%. Meanwhile, Wells Fargo’s net interest income grew by 4% to $11.7 billion.
Net interest margins for the company fell by 4 basis points from the previous quarter to 2.9%. In comparison, JPMorgan Chase reported net interest margins of 2.1%.
Net interest margins of major banks (XLF) (VFH) have been at historical lows as the Federal Reserve has maintained near-zero policy rates. The net interest margin is an important operating metric for banks. It is measured as the spread between the interest income received by banks and the interest paid out to customers on deposits as a percentage of their interest-earning assets.
Wells Fargo and JPMorgan Chase have long been among the most profitable big banks in America (BAC). JPMorgan Chase turned in a 0.99% return on average assets last year and ~1.0% in 2Q16. Comparatively, Wells Fargo generated a return on average assets of ~1.3% in 2015 and 1.2% in 2Q16.
