Newell Brands Sold Its Brands to Hunter Douglas
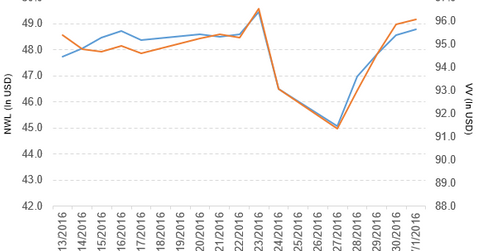
Newell Brands (NWL) has a market capitalization of $24.0 billion. It rose by 0.43% to close at $48.78 per share on July 1, 2016.
July 4 2016, Published 4:42 p.m. ET

Price movement
Newell Brands (NWL) has a market capitalization of $24.0 billion. It rose by 0.43% to close at $48.78 per share on July 1, 2016. The stock’s weekly, monthly, and year-to-date (or YTD) price movements were 4.9%, 1.6%, and 11.7%, respectively, on the same day.
NWL is trading 1.4% above its 20-day moving average, 3.2% above its 50-day moving average, and 13.8% above its 200-day moving average.
Related ETFs and peers
The Vanguard Large-Cap ETF (VV) invests 0.06% of its holdings in Newell Brands. The ETF tracks a market cap–weighted index that covers 85% of the market capitalization of the US equity market. The YTD price movement of VV was 3.7% on July 1.
The market capitalizations of Newell Brands’ competitors are as follows:
Newell Brands sold its brands
Newell Brands has completed the sale of its Levolor and Kirsch window covering brands to Hunter Douglas.
The company also noted, “Gross proceeds from the transaction were ~$270 million, which includes the retention of accounts receivable. The net proceeds of the sale will be used for debt repayment, in line with the Newell Brands capital allocation priority and commitment to achieve a target leverage ratio of 3.0 to 3.5 times over the next 2 to 3 years.”
Performance in 1Q16
Newell Brands reported 1Q16 net sales of ~$1.31 billion, a rise of 4.0% compared to net sales of ~$1.26 billion in 1Q15. Sales of the company’s Writing, Home Solutions, and Baby & Parenting segments rose by 10.8%, 2.1%, and 9.2%, respectively. Sales of its Tools and Commercial Products segments fell by 0.39% and 5.8%, respectively, in 1Q16 compared to 1Q15.
Newell Brands reported restructuring costs of $17.7 million in 1Q16, compared to $27.3 million in 1Q15. It also reported a loss of $45.9 million on the termination of its credit facility in 1Q16.
In 1Q16, Newell Brands’ net income and EPS (earnings per share) fell to $40.5 million and $0.15, respectively, compared to $54.1 million and $0.20, respectively, in 1Q15.
In 1Q16, Newell’s accounts receivable and inventories rose by 12.8% and 2.7%, respectively, compared to 1Q15. It reported cash and cash equivalents of ~$8.2 billion in 1Q16, compared to $215.4 million in 1Q15. Its current ratio and long-term debt-to-equity ratio rose to 4.8x and 6.0x, respectively, in 1Q16, compared to 1.1x and 1.2x, respectively, in 1Q15.
Projections
The company has reaffirmed the following projections for 2016:
- It expects core sales growth in the range of 3.0%–4.0%. It expects legacy Newell Rubbermaid core sales growth of 4%–5% and legacy Jarden core sales growth of 2%–4%, which includes the negative impact of planned product line exits.
- It expects normalized EPS in the range of $2.75–$2.90.
- It expects its effective tax rate to be in the range of 29%–30%.
- It expects to exit production lines with annual sales in the range of $250 million–$300 million across both Newell Rubbermaid and Jarden over the next two to three years.
Next, let’s discuss Ford Motor Company.
