Why Horse Owners Are Suing Archer-Daniels Midland
Archer-Daniels Midland (ADM) has a market cap of $25.2 billion. It fell by 0.21% to close at $43.39 per share on July 20, 2016.
July 21 2016, Updated 5:23 p.m. ET

Price movement
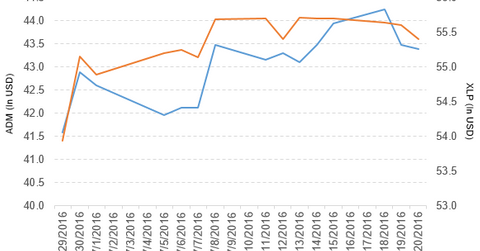
Archer-Daniels Midland (ADM) has a market cap of $25.2 billion. It fell by 0.21% to close at $43.39 per share on July 20, 2016. The stock’s weekly, monthly, and year-to-date (or YTD) price movements were 0.67%, 2.2%, and 20.3%, respectively, on the same day.
ADM is trading 2.3% above its 20-day moving average, 4.2% above its 50-day moving average, and 13.8% above its 200-day moving average.
Related ETFs and peers
The Vanguard Large-Cap ETF (VV) invests 0.15% of its holdings in ADM. The ETF tracks a market-cap-weighted index that covers 85% of the market capitalization of the US equity market.
The Consumer Staples Select Sector SPDR ETF (XLP) invests 1.4% of its holdings in ADM. The ETF tracks a market-cap-weighted index of consumer staples stocks drawn from the S&P 500. The YTD price movement of XLP was 11.0% on July 20, 2016.
The market caps of ADM’s competitors are as follows:
Latest news on ADM
In a press release on July 20, 2016, Reuters reported, “Two horse owners sued Archer Daniels Midland Co this week, accusing the U.S. grain processor and trader of distributing contaminated feed that sickened or killed several of their horses, according to court documents seen by Reuters.”
It also noted, “The lawsuit, filed in U.S. District Court in Northern Illinois on Tuesday, alleges that horse feed produced by ADM Alliance Nutrition Inc was contaminated with monensin, a feed additive that is poisonous to horses. Plaintiffs have sought class-action status for their suit.”
Performance in 1Q16
Archer-Daniels Midland reported fiscal 1Q16 revenues of $14.4 billion, a fall of 17.8% compared to revenue of $17.5 billion in fiscal 1Q15. It reported asset impairment, exit, and restructuring costs of $13 million in fiscal 1Q16.
Operating profit for Agricultural Services and Oilseeds Processing fell by 61.3% and 44.6%, respectively. Operating profits for Corn Processing and Wild Flavors & Specialty Ingredients rose 15.9% and 2.9%, respectively, in fiscal 1Q16 compared to fiscal 1Q15.
ADM’s net income and EPS (earnings per share) fell to $2.3 million and $0.39, respectively, in fiscal 1Q16. That compares to $4.9 million and $0.77, respectively, in fiscal 1Q15.
The company’s cash and cash equivalents and operating working capital fell by 20.7% and 5.9%, respectively, in fiscal 1Q16 compared to fiscal 1Q15. Its debt-to-equity ratio rose to 0.54x in fiscal 1Q16 compared to 0.51x in fiscal 1Q15.
In the next part, we’ll take a look at Sonoco Products (SON).
