Gildan Activewear Declares Its 2Q16 Results and Dividend
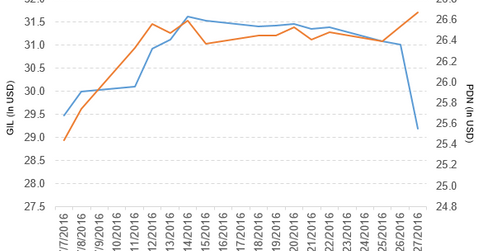
Gildan Activewear (GIL) has a market cap of $6.9 billion. It fell by 5.9% to close at $29.19 per share on July 27, 2016.
July 29 2016, Published 1:16 p.m. ET

Price movement
Gildan Activewear (GIL) has a market cap of $6.9 billion. It fell by 5.9% to close at $29.19 per share on July 27, 2016. The stock’s weekly, monthly, and year-to-date (or YTD) price movements were -7.2%, 7.6%, and 3.3%, respectively, on the same day. GIL is trading 4.2% below its 20-day moving average, 1.9% below its 50-day moving average, and 1.7% above its 200-day moving average.
Related ETFs and peers
The PowerShares FTSE RAFI Developed Markets ex-US Small-Mid Portfolio ETF (PDN) invests 0.13% of its holdings in Gildan. The ETF tracks a fundamentally weighted index of small and mid-cap developed-market securities outside the United States. The YTD price movement of PDN was 2.9% on July 27.
The FlexShares Morningstar Developed Markets ex-US Factor Tilt ETF (TLTD) invests 0.05% of its holdings in Gildan. The ETF tracks an index of equities from developed countries outside the United States. The index favors smaller, value-oriented firms.
The market caps of Gildan Activewear’s competitors are as follows:
Performance of Gildan Activewear in fiscal 2Q16
Gildan Activewear reported fiscal 2Q16 net sales of $688.9 million, a fall of 3.5% from the net sales of $714.2 million in fiscal 2Q15. Sales from the Printwear and Branded Apparel segments fell by 1.4% and 7.9%, respectively, between fiscals 2Q15 and 2Q16. The company’s gross profit margin rose by 2.8% and its operating income fell by 3.3%.
Its adjusted net earnings and adjusted EPS (earnings per share) fell to $96.4 million and $0.41, respectively, in fiscal 2Q16, compared with $102.6 million and $0.42, respectively, in fiscal 2Q15. It reported adjusted EBITDA (earnings before interest, tax, depreciation, and amortization) of $145.1 million in fiscal 2Q16, a fall of 0.55% from fiscal 2Q15.
GIL’s inventories and accounts receivables rose by 8.2% and 49.1%, respectively, between fiscals 4Q15 and 2Q16. It reported a free cash flow of $130.2 million in fiscal 2Q16, compared with $18.5 million in fiscal 2Q15.
Quarterly dividends
Gildan Activewear has declared a cash dividend of $0.08 per share on its common stock. The dividend will be paid on September 6, 2016, to shareholders of record on August 11, 2016.
Projections
The company has made the following projections for fiscal 2016:
- adjusted EPS: $1.50–$1.55
- adjusted EBITDA: ~$545 million–$555 million
- consolidated net sales: ~$2.7 billion, which reflect projected sales of ~$1.7 billion and ~$1 billion in the Printwear and Branded Apparel segments, respectively
- capital expenditure: ~$150 million–$175 million
This guidance includes the acquisition of Alstyle and Peds Legwear, which are projected to contribute aggregate sales of ~$115 million in 2016.
Gildan’s new acquisition
Gildan Activewear has entered into a definitive agreement to acquire 100% of the equity interest of Peds Legwear. This acquisition, worth $55 million in a total cash transaction, is expected to close before the end of August 2016.
The company reported, “The acquisition is expected to create revenue growth opportunities by leveraging Gildan’s existing customer relationships to broaden the channels of distribution for the Peds and MediPeds brands and by extending these brands into Gildan’s other product categories.”
In the next part, we’ll take a look at Silgan Holdings.
