How Did Boston Beer Perform in 2Q16?
Boston Beer reported fiscal 2Q16 net revenue of $244.8 million, a fall of 2.9% compared to net revenue of $252.2 million in fiscal 2Q15.
Nov. 20 2020, Updated 12:34 p.m. ET

Price movement
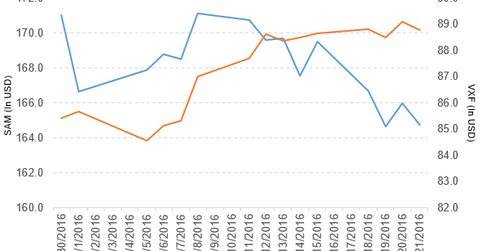
Boston Beer Company (SAM) has a market cap of $2.1 billion. It fell by 0.75% to close at $164.74 per share on July 21, 2016. The stock’s weekly, monthly, and year-to-date (or YTD) price movements were -1.7%, 1.8%, and -18.4%, respectively, on the same day.
SAM is trading 1.1% below its 20-day moving average, 2.9% above its 50-day moving average, and 11.6% below its 200-day moving average.
Related ETFs and peers
The Vanguard Extended Market ETF (VXF) invests 0.05% of its holdings in Boston Beer. The ETF tracks a market-cap-weighted version of the S&P Total Market Index, excluding all S&P 500 stocks. The YTD price movement of VXF was 6.6% on July 21.
The iShares Russell 2000 ETF (IWM) invests 0.15% of its holdings in Boston Beer. The ETF tracks a market-cap-weighted index of US small-cap stocks. The index selects stocks ranked 1,001 to 3,000 by market cap.
The market caps of Boston Beer’s competitors are as follows:
Performance of Boston Beer in fiscal 2Q16
Boston Beer reported fiscal 2Q16 net revenue of $244.8 million, a fall of 2.9% compared to net revenue of $252.2 million in fiscal 2Q15. The company’s gross profit margin and operating income fell by 4.0% and 10.7%, respectively, in fiscal 2Q16 compared to fiscal 2Q15. It sold ~1.1 million barrels in fiscal 2Q16, a fall of 4.0% compared to fiscal 2Q15.
Its net income and EPS (earnings per share) fell to $26.6 million and $2.06, respectively, in fiscal 2Q16 compared to $29.9 million and $2.18, respectively, in fiscal 2Q15.
Boston Beer’s cash and cash equivalents fell by 70.7%, and its inventories rose by 8.3% in fiscal 2Q16 compared to fiscal 4Q15. Its current ratio fell to 1.5x, and its debt-to-equity ratio rose to 0.43x in fiscal 2Q16 compared to a current ratio and a debt-to-equity ratio of 2.0x and 0.40x, respectively, in fiscal 4Q15.
Projections
Boston Beer has made the following projections for fiscal 2016:
- EPS in the range of $6.40 to $7.00
- gross margin in the range of 50% to 52%
- effective tax rate of ~36.3%
- It expects depletion and shipments percentage change in the range of -4% to 0%.
For an ongoing analysis of this sector, please visit Market Realist’s Consumer Discretionary page.
