Why Did Philip Morris Fall 4% on June 24?
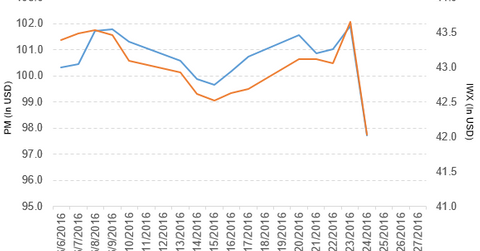
Philip Morris International (PM) has a market cap of $151.6 billion. It fell by 4.1% to close at $97.71 per share on June 24, 2016.
June 28 2016, Published 5:36 p.m. ET

Price movement
Philip Morris International (PM) has a market cap of $151.6 billion. It fell by 4.1% to close at $97.71 per share on June 24, 2016. The stock’s weekly, monthly, and year-to-date (or YTD) price movements were -2.0%, -0.35%, and 13.5%, respectively, on the same day.
This means that PM is trading 1.9% below its 20-day moving average, 1.0% below its 50-day moving average, and 9.0% above its 200-day moving average.
Related ETF and peers
The iShares Russell Top 200 Value ETF (IWX) invests 0.99% of its holdings in Philip Morris. The ETF tracks an index of US large-cap value stocks. It selects from stocks ranked 1–200 by market cap based on two style factors. The YTD price movement of IWX was 0.76% on June 24, 2016.
The market caps of Philip Morris’s competitors are as follows:
Philip Morris fell after Brexit
On June 24, 2016, Reuters stated, “We expect that investors will view global tobacco as a relatively safe haven in a risk-off environment.” Investors have considered tobacco stocks as safer stock compared to other industries after the United Kingdom voted to leave the European Union (or the Brexit).
In the case of Philip Morris, the company has generated 30.1% of its revenue from the European Union. It was second highest in terms of revenue after Asia in 2015. It has more risk exposure compared to other tobacco companies, so it fell more than 4.0% on June 24, 2016, after the Brexit vote.
Performance of Philip Morris in fiscal 1Q16
Philip Morris reported fiscal 1Q16 net revenues of $16.8 billion, a fall of 3.3% from net revenues of $17.4 billion in fiscal 1Q15. In fiscal 1Q16, net revenues from the European Union, the EEMA (Eastern Europe, the Middle East, and Africa), Asia, and Latin America and Canada segments fell 4.5%, 10.2%, 8.7%, and 10.5%, respectively, from the corresponding period last year. The company’s gross profit and operating income fell by 9.1% and 13.9%, respectively, between fiscal 1Q16 and the prior year.
The company’s net income and EPS (earnings per share) fell to $1.5 billion and $0.98, respectively, in fiscal 1Q16, compared to $1.8 million and $1.16, respectively, in fiscal 1Q15.
Philip Morris’s cash and cash equivalents fell by 13.8% between fiscal 4Q15 and fiscal 1Q16. It reported a free cash flow of $236.0 million in fiscal 1Q16 compared to -$578.0 million in fiscal 1Q15.
Projections
Philip Morris has made the following projections for fiscal 2016:
- EPS of $4.40–$4.50, which doesn’t include share repurchases
- 2.0%–2.5% decline in international cigarette volume, which excludes China and the United States
These projections don’t include the impact of future acquisitions, unanticipated asset impairment and exit cost charges, future changes in currency exchange rates, or any unusual events.
In the next part of this series, we’ll take a look at General Mills.
